Download

1 / 57
600 likes | 904 Vues
AP macroeconomics Unit 4: Long Run Economic growth and loanable funds . Topic 1: Review of AD/AS graph. What is the AD/AS graph used to illustrate??? 1. changes in price level 2. changes in quantity of real GDP/output 3. changes in employment 4. FISCAL POLICY action .

E N D
AP macroeconomics Unit 4: Long Run Economic growth and loanable funds
Topic 1: Review of AD/AS graph What is the AD/AS graph used to illustrate??? 1. changes in price level 2. changes in quantity of real GDP/output 3. changes in employment 4. FISCAL POLICY action
Reasons AD curve will shift: • 1. Change in C (*wealth, income taxes, confidence) *Wealth = the value of all things a person owns. ASSETS How much $ a person earns (wage/income) is NOT the same thing as wealth
Reasons AD curve will shift: • 2. Change in I (includes business taxes) • 3. Change in G • 4. Change in Xn *FISCAL POLICY impacts this curve
Reasons SRAS curve will shift??? 1. Change in resources quality and quantity • Change in price of resources (wages) • Change in business taxes • Change in legalities • Change in technology • Change in productivity *This curve can SELF ADJUST in the long run due to flexible wages
Reasons LRAS will shift??? 1. change in resources quality and quantity 2. Change in technology
Topic 2: Review of Phillips curve graph • What is the Phillips curve used to illustrate?? The relationship between inflation and unemployment
Reasons Phillips curve will shift: Inflation and unemployment both move in the same direction
Topic 3: Review of money market graph What is the money market graph used to illustrate??? 1. changes in NOMINAL interest rate 2. MONETARY policy action
Reasons Md will shift • 1. Change in price level • 2. change in real GDP
Reasons Ms will shift • Fed action (monetary policy) changing the reserve ratio changing the discount rate open market operations
Review of multipliers See practice WS
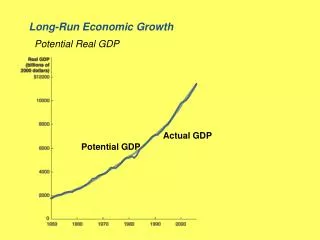
Topic 4:Long Run Economic growth Long Run Economic growth 1. The increase in real GDP which occurs over a period of time 2. The increase in real GDP per capita which occurs over a period of time
Calculation of Rate of Growth Example: Real GDP this year is $11 million. Last year, real GDP was $10 million. What is the Growth rate???
Ingredients of economic growth Supply Factors: • Increases in the quantity and quality of natural resources • Increases in the quantity and quality of human resources/human capital (ex education) • Increases in the supply of capital stock • Improvements in technology
Ingredients of Economic Growth • 5. Demand Factor To achieve higher production created by the supply factors, households, businesses and G must purchase the expanding output
Ingredients of Economic growth • Efficiency productive efficiency: Use of resources in least costly way allocative efficiency: produce what society desires
Graphing economic growth • 1. Can be shown as an outward shift in a nation’s production possibilities curve • 2. Can be shown as a rightward shift of a nation’s LRAS curve
Topic 5: The Financial System • Consists of institutions that help match one person’s savings with another person’s investment • The Financial System is made up of financial institutions (2 types) 1. financial markets 2. financial Intermediaries
Financial Markets • Institutions through which savers can directly provide funds to borrowers • Examples: stock market and the bond market
Financial Intermediaries • Financial institutions through which savers can indirectly provide funds to borrowers Example: Banks
Topic 6: loanable funds theory of interest • Looks at the impact of an action on REAL interest rates
Nominal Interest Rate (i) The actual interest rate Measures the annual percentage increase in the nominal (current dollar) value NIR = RIR + inflation rate Real Interest Rate (r) Interest rate taking inflation into account RIR = NIR – inflation rate
Nominal vs. Real Interest Rates Example: You lend out $100 with 20% interest. Inflation is 15%. Nominal interest rate = 20% Real interest rate = 5% Example: You borrow $100 with 10% interest. Prices increase 13%. Nominal interest rate = 10% Real interest rate = -3%
Topic 7: The Supply of Loanable Funds The supply of loanable funds comes from SAVINGS – INVESTMENT for SAVINGS
Examples of Savings: • Purchase a certificate of deposit at a bank • Put money into savings account at a bank • Purchase corporate stock or bonds • Buy shares of a mutual fund
Supply of Loanable funds • A high real interest rate is an incentive to save. • The real interest rate is the OPPORTUNITY COST of spending example: You decide to spend your money rather than save it – the interest rate you could have earned on your money is what you give up
Reasons the Supply of loanable funds will shift: • A change in disposable income more disposable income = more savings less disposable income = less savings 2. A change in taxes on interest income increase in taxes = less savings decrease in taxes = more savings • Anything that can impact savings (INVESTING FOR THE FUTURE) • FOREIGN INVESTMENT (SAVINGS)
Supply in money market vs supply in loanable funds • Money market graph = source of supply from the Fed • Loanable Funds graph = source of supply from savers
In order for firms to increase their capital stock, they must purchase machinery, tools and education for their workers. • Firms must often borrow $ to do this
Demand for Loanable funds The sources of demand are the economy’s businesses who want to borrow $ to acquire more factories, inventory and equipment The demand for loanable funds = BORROWING FOR INVESTMENT (BORROWING TO IMPROVE BUSINESS) Investment = purchase of capital goods, construction and inventory IT IS NOT the buying of STOCK
Examples of INVESTMENT -GM spends $250 million to build a new factory -you buy $5,000 worth of computer equipment for your business - your parents spend $200,000 to have a new house built
Demand for loanable funds If firms must borrow funds, they regard the REAL rate of interest as a cost for an Investment Example: firms expect profits to increase by 5% due to a new investment of which they can borrow at a 3% rate of interest. Should this firm borrow the money???
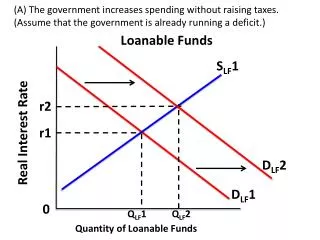
Reasons the Demand for loanable funds will shift: 1. A change in investment tax credits (tax break) more tax credits = more investment less tax credits = less investment • A change in business/corporate tax laws more taxes = less investment less taxes = more investment • Change in the expected rate of profit more expected profit = more investment less expected profit = less investment 4. A change in the government’s budget deficit increase in budget deficit = increase in D decrease in budget deficit = decrease in D
Topic 9: Relationship between supply and demand of Loanable funds • The long run amount of savings directly affects the amount of money available for investment • Savings rate in a country is the single most important determinant of investment more investment = more capital stock more capital stock = Long run growth
The market for Loanable Funds • The market in which those who want to save supply funds and those who want to borrow to invest demand funds Assume: only one financial market - all savers deposit their savings in this market - all borrowers take out loans from this market
Loanable Funds Market At the equilibrium real interest rate, the amount borrowers want to borrow equals the amount lenders want to lend. SAVINGS = INVESTMENT Real Interest Rate S(savings) re D(Investment) QLoans Quantity of Loans 50