Download

1 / 45
460 likes | 665 Vues
Loanable Funds Market. Chapter 24. TIPS Bond. The US Treasury offers bonds whose principal and coupon payments increase with the inflation rate. Investors are paid off in terms of real purchasing power. Yield is equivalent to a real interest rate. . Additional Information from U.S. Treasury.

E N D
Loanable Funds Market • Chapter 24
TIPS Bond • The US Treasury offers bonds whose principal and coupon payments increase with the inflation rate. • Investors are paid off in terms of real purchasing power. • Yield is equivalent to a real interest rate. Additional Information from U.S. Treasury
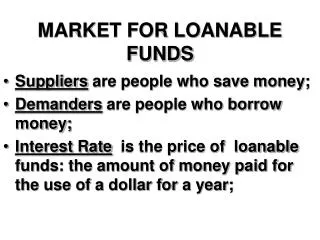
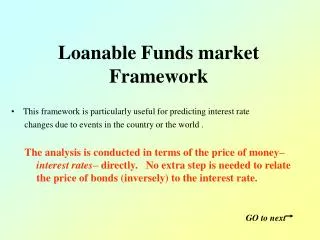
Loanable Funds Market • Consider the financial market at its broadest and most abstract. • an amalgamation of the bond market and the lending market (banks, etc.) • Map the relationship between the real interest rate and the quantity of funds that are lent. • Supply curve represents the behavior of savers & lenders • Demand curve represents the behavior of borrowers
Demand Curve: Loanable Funds • Why does the demand curve slope down? • Firms borrow to finance investment projects. If the return on investment falls below the interest rate, the project is not worthwhile. The higher the interest rate, the fewer projects are above the hurdle. • Households borrow to finance housing. The higher are interest rates, the smaller is the house that the householders can buy with a mortgage payment that they can afford.
Supply Curve: Loanable Funds • Why does the supply curve slope up? Substitution Effect: When real interest rates offered by banks are high, savers are rewarded with more future consumption and are likely to be induced to save more.
Closed economy equilibrium • In closed economy, market forces should cause supply and demand for loanable funds to equilibrate at a real interest rate where supply equals demand. • Shifts in demand or supply change equilibrium real rate as in standard supply-demand model.
Competitive Market Equilibrium:Loanable Funds Market r DLF SLF LF
Competitive Market Equilibrium:Loanable Funds Market SLF DLF r r* LF LF*
Demand for Loanable Funds:Determinants Private • Real interest rate – • Restrictions (LtV, Collateral Constraints) Corporate • Profitability of business projects + • Uncertainty of business investment – • Retained earnings – Mortgage Market • Demand for Housing + Public • Government Deficits + • Corporate Profits Tax –
Supply of Loanable Funds:Determinants Private • Real interest rate + Household • Disposable Income + • Expected Future Income – • Value of Assets/Wealth – • Default Risk – • Uncertainty of Future Income + Public • Government Surplus + • Interest Income Tax –
Ex. Uncertainty about Future Capital Infrastructure Investment r DLF' SLF DLF 1 r* 2 r** LF LF** LF*
Consumers become more worried about the future. r DLF SLF SLF' 1 r* 2 r** LF LF* LF**
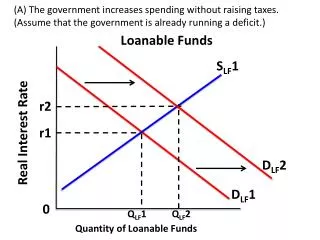
Government Surplus • Government surplus is gap between govt revenue and outlays and can be positive or negative. • If net positive, it adds to the supply of loanable funds. • If net negative, it adds to the demand for loanable funds.
Example: Swiss Government strikes a deal to raise taxes and cut spending r DLF SLFP SLF 1 r* 2 r** LF LF* LF**
Example Japan Government runs a deficit to finance infrastructure reinforcement. Budget Plan r SLF DLF DLFP r** 2 1 r* LF** LF* LF
Globalization and the Loanable Funds Market • OUaT, we might have thought of the loanable funds market as being national in nature – especially for large economies. These days it appears that even the USA is part of a single global market. [China possible exception] • Otherwise take global interest rate as given.
SOURCE: PRELIMINARY REPORT: 27 JULY 2011, BIS REPORTING BANKS HTTP://WWW.BIS.ORG/STATISTICS/BANKSTATS.HTM Perspectives on Financial Globalization
SOURCE: BIS QUARTERLY REVIEW: 'JUNE 2011TABLE 12A: INTERNATIONAL DEBT SECURITIES - ALL ISSUERS HTTP://WWW.BIS.ORG/STATISTICS/SECSTATS.HTM
Competitive Market Equilibrium:World Loanable Funds Market SLFW r DLFW rW LF LFW
National Loanable Funds Markets in a Global World • How do national economies relate to the global financial market? • Countries will face an external interest rate, rW, unaffected by national savings or investment. • International lending (borrowing) will make up the gap between savings and investment.
Competitive Market Equilibrium:Demand exceeds Supply r SLF DLF rW International Borrowing LF
Investment Boom Mongolia[r Doesn’t Rise, Gap made up by Capital Inflows] r SLF DLF' DLF Boomtown Mongolia Financial Times 1 2 rW Borrowing LF LF* LF**
Competitive Market Equilibrium:Supply exceeds Demand SLF r DLF International Lending rW LF
Bloomberg Norway Wealth Fund 40% Bonds Oil Fields Running at peak, Norway(r does not fall, gap made up by capital outflows) r SLF' SLF DLF Lending 2 rW 1 LF
Global LF Market • Only very large changes in large countries or international trends will have an impact on real interest rates.
Savings Glut • Theory put forth by Fed Chairman explaining the U.S. trade deficit: Washington Post Article
Growing Gap between savings & investment in Asia IMF Regional Outlook Asia Pacific 2010
Birth rate Natural increase Death rate Time Note: Natural increase is produced from the excess of births over deaths. The Classic Demographic TransitionModel Link Stage 1 Stage 2 Stage 3 Stage 4
Link Population by age, sex and urban/rural residence Aging Population Structure
Savings Glut SLFW SLFW ' r DLFW DLFW' rW rWW LF LFW
World Interest Rate Falls(Passive Response Economy) r DLF SLF 1 rW 2 2 rWW International Borrowing LF
China Loanable Funds Market • High savings rates even relative to high investment, limited alternative equity assets, real estate very expensive. • Capital Controls prevent purchase of foreign reserves • Gov’t setting of deposit and lending rates (even long term) • Limited number of firms deemed eligible for credit • State Owned Banks have Excess Funds • SAFE absorbs these funds and buys foreign reserves.
Loanable Funds Market China SLF r DLF International Lending rREG LF
Nominal YIeLds Optional
Savings and investment decisions must be made before future inflation is known so they must be made on the basis of an ex ante (predicted) real interest rate. Fisher Hypothesis: Ex ante real interest rate is determined by forces in the financial market. Money interest rate is just the real ex ante rate plus the market’s consensus forecast of inflation. Ex Ante Rate and the Fisher Effect
Great Inflation of the 1970’s Source: St. Louis Federal Reserve http://research.stlouisfed.org/fred2/ Great Inflation Download
Loanable Funds MarketFisher Effect NSLF NDLF SLF DLF i* r* LF* LF
Learning Outcome • Use the Loanable Funds model to analyze the effects of events on savings, investment, and real interest rates in capital markets. • Model Global Loanable Funds market and the determinants of current accounts. • Use expected inflation and the Fisher effect to determine nominal interest rates.