Download
1 / 54
540 likes | 556 Vues
This presentation reviews fundamental concepts of ionizing radiation, radiation biology and health effects, current radiation risk models, and the attributes of the Linear Non-Threshold (LNT) Model. It also discusses the effects of dose rate and synergistic effects. Presented at George Mason University on October 9th, 2013.

E N D
Linear Non Threshold for Radiation Health Effects Osher Lifelong Learning Institute George Mason University October 9, 2013 Carl Tarantino, CHP Keith Welch, RRPT
Objectives • To review fundamental concepts of ionizing radiation • To review the basic tenets of radiation biology and health effects • To describe current radiation risk models • To describe the attributes of the Linear Non Threshold (LNT) Model • What does biology say about LNT • Cell death curve characteristics • Dose Rate influences • Effects of promoters/inhibitors (Synergistic Effects)
What is Radiation? • Radiation= energy in transit …The transfer of energy by waves or particles • Ionizing radiation has sufficient energy to produce energetic ions in ordinary matter …”dose” is caused by the absorption of the kinetic energy of these charged particles Alpha and Beta particles, Gamma- & X-rays, Neutrons • Non-ionizing radiation does not produce energetic ions Radio, Microwave, UV, IR, Visible
Ionization Electron ejected from orbit + Ion - Ion Ionizing radiation
Penetration of Radiation in Tissue Alpha Particles Stopped by dead layer of skin Beta Particles Penetrate skin but max range is few mm Gamma Rays Very penetrating Neutrons Very Penetrating
LET and RBE • Linear Energy Transfer - LET • Rate of energy dissipation per unit track length of radiation passing through matter • Generalized as low or high LET dependent on type of radiation • Low-LET radiations (“sparsely ionizing”) – gamma, x-ray • High-LET radiations (“densely ionizing”) – alpha, neutron • Related to radiation “quality” and biological effect • Relative Biological Effectiveness – RBE • Customarily based on 250 keV x-rays as the reference radiation • RBE is the ratio of the dose of x-rays to that of some other radiation required to produce the same biological effect (in vitro lab results) • RBE evolved to become Radiation Weighting Factors assigned by ICRP – specifically applicable to biological effect of interest in radiation protection work - cancer risk for low-dose exposures
Quantifying/Measuring Dose and Risk • The radiation weighting factor is used to convert the absorbed dose (energy absorbed per unit mass) from radiations of differing quality into a unit that expresses the exposure normalized to risk – equivalent dose. • Radiation weighting factor is denoted by WR. • Absorbed dose (D) is related to equivalent dose (H) through the formula: H = D WR The unit of absorbed dose is the gray (Gy) The unit of equivalent dose is the sievert (Sv) • Thus, Sv = Gy x WR(rem = rad x WR)
Old UnitsSI UnitsWhat It Is Ionizing Radiation Units 1 C kg-1 = 3876 R rad Gray 1 Gy = 100 rad rem Sievert 1 Sv = 100 rem
Quantifying/Measuring Dose and Effects • Exposure (X): Generically, exposure is the condition of being exposed. Exposure is also used to quantify the amount of ionization produced by photonsas they pass through air. The unit of exposure in the U.S. is the Roentgen (R). The S.I. unit is C/kg. 1R = 2.58x10⁻⁴ C/kg or 1esu/cc (in dry air at STP) • Absorbed Dose (D): Absorbed dose is the amount of energy deposited in any material by ionizing radiation. The unit of absorbed dose used in the U.S., the rad, is a measure of energy absorbed per gram of material. The S.I. unit is the Gray (Gy). One Gray equals 100 rad. • Equivalent Dose (H): Equivalent dose is a special concept relating absorbed dose to biological detriment. In the U.S. the unit is the rem. The S.I. unit is the Sievert (Sv). One Sievert equals 100 rem.
Direct Action: critical structures are the targets. http://jolisfukyu.tokai-sc.jaea.go.jp/fukyu/mirai-en/2008/6_5.html
Indirect Action: water and other non-critical molecules are the targets. Radiation ionizes H2O molecule leading to hydrolysis and the creation of very reactive radicals.
H2O H2O+ + e- H2O+ + H2O H3O+ + OH Water Hydrolysis • Radiation ionizes a water molecule • The ion reacts with another water molecule to form a highly reactive hydroxyl radical
OH + OH H2O+ H+ + OH H2O2 H2O + e- H2O - H + O2 HO2 (if dissolved O2 is present) H2O - H + OH- HO2 + H H2O2 Water Hydrolysis • Body fluids normally contain H+ and OH- ions. • Free radicals may eventually interact with and damage DNA molecules (indirect action). hydrogen peroxide! H + H H2
http://symmetrydirectbuy.com/what-are-free-radicals-and-what-effect-do-antioxidants-have-on-them/http://symmetrydirectbuy.com/what-are-free-radicals-and-what-effect-do-antioxidants-have-on-them/
Potential Outcomes of Radiation Damage to Parent Cells NO EFFECT
Effects of Radiation on Cells • Event is not important to cell function - no real effect (most likely). • Damage is repaired- no lasting effect. • Damage is repaired incorrectly- cell may function abnormally (uncontrolled division cancer could develop). • Cell is so damaged it dies-only a problem if many cells die at once (acute dose).
Cellular Sensitivity • Not all cells are created equal! • Law of Bergonie & Tribondeau: cell radiosensitivity increases with • reproductive rate of cell • low morphological/functional differentiation (i.e. specialized cells are LESS sensitive!) • Other effects on cell sensitivity • long mitosis • high oxygenation Radiosensitive Tissues: • Germinal (reproductive) cells of the ovary and testis (e.g., spermatogonia) • Hematopoietic (blood forming) tissues: red bone marrow, spleen, lymph nodes, thymus • Basal cells of the skin • Epithelium of the gastrointestinal tract (interstitial crypt cells) Radioresistant Tissues: • Bone • Liver • Kidney • Cartilage • Muscle • Nervous tissue Highly specialized, non-dividing, very mature
Cellular Sensitivity • Lymphocytes MOST SENSITIVE • Spermatogonia • Hematopoietic (Blood Forming) • Intestinal Epithelium • Skin • Nerve Cells • Muscle Tissue • Bone • Collagen LEAST SENSITIVE
Categories of Effects • Stochastic effect • Occurs by chance (random) • Risk increases with increasing dose • e.g., cancer and genetic mutations • Deterministic (Non Stochastic) effect • Usually does not occur below some threshold dose • Occurs as a result of non-random events • Severity increases with increasing dose • e.g., cataracts, sterility, ARS
Categories of Effects • Acute (Prompt) Somatic • Immediate effects to the organism receiving the dose • Due to acute dose • Delayed (Latent) Somatic • Effects that appear years later to organism receiving the dose • Cancer is an example • Can be caused by low doses • Genetic (Heritable) • Effects that appear in offspring of exposed • No evidence seen from human exposures, but clear evidence seen in animal/plant studies • Teratogenic • Effects in embryo/fetus that is directly exposed • Cancer, growth abnormalities, death have been seen due to acute doses • First 20 weeks of pregnancy are the most sensitive
Biological Effects from Low Doses of Radiation Biological effects from low doses potentially occur due to chronic exposures. A chronic exposure occurs when a relatively small amount of radiation is absorbed by tissue over a long period of time. • Under 5 rad of exposure - No detectable health effects in exposed individual • Chronic exposures result in an increased risk in latent adverse health effects • Health effects could be genetic effects or somatic effects
Latency period is the time from time of exposure until the effect is exhibited Time radiation dose received Latent period Period at risk Risk curve Risk 0 4 30 Time (years) Latency Period • Radiation exposure does not produce cancer in every exposed person • Effects can be immediate or years later for acute, high-level exposures Leukemia latency and time at risk periods
Biological Effects from High Doses of Radiation Biological effects from high doses occur due to acute exposures. An acute exposure occurs when a relatively large amount of radiation is absorbed by tissue over a short period of time; effects can occur in the short term and long term. • Hematopoietic Syndrome: (100-200 rad or 1-2 Gray) Early symptoms are anorexia, nausea, and vomiting followed by a phase of bone marrow depression and subsequent susceptibility to infection. After several weeks, death may occur. • Gastrointestinal Syndrome: (700-1000 rad or 7-10 Gray) Early symptoms are anorexia, nausea, and vomiting followed by fever, diarrhea, and electrolyte imbalance due to ulceration of the intestinal wall. Once GI system ceases to function, death will occur. • Central Nervous System Syndrome: (2000-5000 rad or 20-50 Gray) Symptoms occur very quickly and the brain and muscles can no longer control bodily functions, including breathing and blood circulation. Death within hours or within several days.
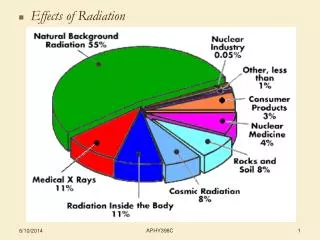
Sources of Radiation Average doses in the US: ~ 6 mSv/y Current US occup. limit: 50 mSv/y
Possible Radiation Dose Response Curves • LNT: An increase in dose results in a proportional increase in risk without threshold • At low doses there is only a slight increase in risk that becomes proportional to dose at higher doses • There is a threshold for dose response at which lower doses do not result in increased risk • At low doses there is a higher risk that becomes proportional to dose at higher doses • Hormesis model (not shown): Low doses of radiation have a positive effect and decrease risk Effect Dose
What are the Bases for the Models? • Atomic bomb survivors • Highly exposed early radiation workers • Workers/public exposed due to accidents • Patients undergoing radiation therapy • Nuclear Medicine misadministrations • Laboratory animal studies • In vitro cell studies • More recent radiation workers • Background radiation exposures Knowledge of radiation carcinogenesis has evolved within the larger context of cancer etiology
What do the Studies Show? Epidemiology – Atomic bomb survivors Risk increases…”in approximate proportion to radiation dose” Ozasa et al., Rad Res 177; 2012
What do the Studies Show? Epidemiology – Atomic bomb survivors Leukemia “…generally increasing trend with dose…” “…failed to suggest the existence of radiation hormesis.” Kato et al., Health Phys.; 1987
What do the Studies Show? Epidemiology – Atomic bomb survivors Current annual radiation worker limit in U.S. Excess relative risk based on linear model: 42%/Gy Ozasa et al., Rad Res 177; 2012
What do the Studies Show? Epidemiology – Radium Dial Painters • High-LET radiation (alpha) • Bone sarcoma primary malignant effect • Clear threshold response • “Practical” threshold at about 10 Gy • No excess leukemia Rowland et al., Health Phys., 1983
What do the Studies Show? Epidemiology – Rocketdyne Workers Cohort: ~5700 Mean dose: 14.7 mSv Boice et al., Rad Res, 2006
What do the Studies Show? Epidemiology – Nuclear Plant Workers • 15 U.S. Nuclear Facilities • Occupational Worker cohort for period 1979 – 1997 • Cohort demonstrated healthy worker effect, i.e. significantly lower cancer and noncancer mortality than general population • Occupational Worker population routinely exposed to low doses of low-LET whole body ionizing radiation received at low dose rates (i.e. several mSv/yr) • Excess Relative Risk (EER) estimates for leukemias and solid cancers very similar to EER estimates found in the atomic bomb survivors Cohort: ~53,000 Mean dose: 30.7 mSv
What do the Studies Show? Epidemiology – Populations around nuclear facilities Risk higher before startup of facilities – Statistically significant? Jablon et al., JAMA, 1991
What do the Studies Show? Laboratory Studies – Cell Survival Characteristic shoulder • In vitro irradiation • Cell death = inability to replicate • All mammalian cell lines exhibit this behavior • Slope of the line represents radiosensitivity • Width of shoulder and slope vary with cell type • Initiated idea of sub-lethal damage and cell repair • Dose usually given at high rates Low-LET radiation (gamma, x-ray) High-LET radiation (neutron, alpha) Puck & Markus, JEM 1956
What do the Studies Show? Laboratory Studies – Cell Survival and Dose Rate CHO (Chinese hamster) cell survival for different dose rates Width of shoulder and slope of the line beyond the shoulder are affected by the dose rate Rate effect more dramatic in CHO cells than HeLa cells 200 mGy/h 500 mGy/h 9.6 Gy/h 18 Gy/h 64.2 Gy/h Bedford and Mitchell Rad Res, 1973
What do the Studies Show? Laboratory Studies – Cell Survival and Dose Rate In vivo mouse cell exposures Intestinal crypt cells Dose rate effect as with in vitro studies Primary conclusion from these studies is related to cell repair 300 mGy/h 550 mGy/h 2.7 Gy/h 21.6 Gy/h 164 Gy/h Fu and Phillips Radiology, 1975
What do the Studies Show? Laboratory Studies – Leukemia in Mice • Effect of dose rate on leukemia • Highest dose rate exceeds LD50 in humans in 5 minutes • In occupational exposure setting, the lowest dose rate (240 mrad/h) is considered a “high radiation area” 60 Incidence (%) 40 20 0 0 2 4 6 Dose (Gy) Upton et al., Rad Res, 1970
What do the Studies Show? Laboratory Studies – Secondary Factors - AP: Tumor inhibitor - TPA: Tumor promotor These studies highlight the role of sub-lethal damage Implications for low dose exposures may be important Little, Rad Res, 1981
But Wait, There’s More… What about hormesis?
Threshold “As the dose below the standard threshold becomes progressively more dilute, the response becomes more likely to exceed the control value (hormetic-like).” LNT Hormesis Nature, 2003
Some Conjecture Based on the Above Radiation doses at this level are not a primary factor for carcinogenesis Doses in this range may be linked to risk, but errors are large Risk approximately linear with dose ERR in the range of 50%/Gy
A Reasonable Interpretation? Another way to depict the idea of a variable low-dose outcome becoming definitive at high dose Outcomes in this dose range depend more on non-radiological factors than on dose Risk Dose
Conclusions • Given all the uncertainties, what can we say with any reasonable level of confidence about low-dose radiation? • ICRP conclusions: ... the adoption of the LNT model combined with a judged value of a dose and dose rate effectiveness factor (DDREF) provides a prudent basis for the practical purposes of radiological protection, i.e., the management of risks from low-dose radiation exposure. (ICRP Pub. 103, 2007)
Conclusions • UNSCEAR: In general, increases in the incidence of health effects in populations cannot be attributed reliably to chronic exposure to radiation at levels that are typical of the global average background levels of radiation... Therefore, the Scientific Committee does not recommend multiplying very low doses by large numbers of individuals to estimate numbers of radiation-induced health effects within a population exposed to incremental doses at levels equivalent to or lower than natural background levels; UNSCEAR Sup. 46, 2012
Conclusions • Health Physics Society: …the Society has concluded that estimates of risk should be limited to individuals receiving a dose of 50 mSv in one year or a lifetime dose of 100 mSv in addition to natural background…Below these doses…expressions of risk should only be qualitative, that is, a range based on the uncertainties in estimating risk…emphasizing the inability to detect any increased health detriment (that is, zero health effects is a probable outcome). HPS Position Paper PS010-2, 2010
Conclusions • Practical inferences • LNT can be used to help estimate radiation risks • The LNT model probably doesn’t under-estimate the risks, and may over-estimate them • LNT is useful for “radiation protection” • When applied with care, can be used to quantitatively estimate risks for persons with non-trivial doses • Useful in making ALARA comparisons and decisions • Should not be used for quantitative risk assessments when doses are < 100 mSv • Should not be applied to collective doses of low-dose populations (within the range of normal background dose)
Risks in Perspective • Risk of cancer increases in a generally proportional way with radiation dose. The exact relationship of dose to risk is not known for low doses. • About 55% of US citizens get cancer (normal incidence). • About 25% of US citizens die from cancer (normal mortality). • The approximate excess relative risk for radiation is about 40%/Sv. • Extrapolating to the lowest level for which quantitative estimates should be considered, gives the following: • In a population of 100,000 people, all exposed to 100 mSv*, we would predict about 1000 excess cancer deaths • Studies of people with doses in this range do not show a clearly measurable risk in such populations • There will be about 25,000 non-radiation cancer deaths in this population *100 mSv is almost 100 times the normal annual background from cosmic, terrestrial, and internal radiation sources combined.
Conclusions “The dose makes the poison.” Paracelsus, circa 1520 “All models are wrong, some models are useful.” George Box, industrial statistician, 1979