Download

1 / 57
570 likes | 807 Vues
Chapter 6. Bonds, bond prices and interest rates. Bond prices and yields Bond market equilibrium Bond risks. Bonds: 4 types. zero coupon bonds e.g. Tbills fixed payment loans e.g. mortgages, car loans coupon bonds e.g. Tnotes, Tbonds consols. Zero coupon bonds. discount bonds

E N D
Chapter 6. Bonds, bond prices and interest rates • Bond prices and yields • Bond market equilibrium • Bond risks
Bonds: 4 types • zero coupon bonds • e.g. Tbills • fixed payment loans • e.g. mortgages, car loans • coupon bonds • e.g. Tnotes, Tbonds • consols
Zero coupon bonds • discount bonds • purchased price less than face value -- F > P • face value at maturity • no interest payments
example • 91 day Tbill, • P = $9850, F = $10,000 • YTM solves
F - P 360 idb = x F d yield on a discount basis (127) • how Tbill yields are actually quoted • approximates the YTM
example • 91 day Tbill, • P = $9850, F = $10,000 • discount yield =
idb < YTM • why? • F in denominator • 360 day year
fixed-payment loan • loan is repaid with equal (monthly) payments • each payment is combination of principal and interest
example 2: fixed pmt. loan • $20,000 car loan, 5 years • monthly pmt. = $500 • so $15,000 is price today • cash flow is 60 pmts. of $500 • what is i?
i is annual rate • (effective annual interest rate) • but payments are monthly, & compound monthly • (1+im)12 = i • im= i1/12-1 • im is the periodic rate • note: APR = im x 12
im=1.44% i=(1+. 0144)12 – 1 =18.71%
how to solve for i? • trial-and-error • table • financial calculator • spreadsheet
Coupon bond • (chapter 4)
Bond Yields • Yield to maturity (YTM) • chapter 4 • Current yield • Holding period return
Yield to Maturity (YTM) • a measure of interest rate • interest rate where P = PV of cash flows
Current yield • approximation of YTM for coupon bonds annual coupon payment ic = bond price
better approximation when • maturity is longer • P is close to F
example • 2 year Tnotes, F = $10,000 • P = $9750, coupon rate = 6% • current yield 600 ic = = 6.15% 9750
current yield = 6.15% • true YTM = 7.37% • lousy approximation • only 2 years to maturity • selling 2.5% below F
Holding period return • sell bond before maturity • return depends on • holding period • interest payments • resale price
example • 2 year Tnotes, F = $10,000 • P = $9750, coupon rate = 6% • sell right after 1 year for $9900 • $300 at 6 mos. • $300 at 1 yr. • $9900 at 1 yr.
i/2 = 3.83% i = 7.66%
why i/2? • interest compounds annually not semiannually
The Bond Market • Bond supply • Bond demand • Bond market equilibrium
Bond supply • bond issuers/ borrowers • look at Qs as a function of price, yield
lower bond prices • higher bond yields • more expensive to borrow • lower Qs of bonds • so bond supply slopes up with price
S Bond price Q of bonds
Changes in bond price/yield • Move along the bond supply curve • What shifts bond supply?
Shifts in bond supply • Change in government borrowing • Increase in gov’t borrowing • Increase in bond supply • Bond supply shifts right
S S’ P Qs
a change in business conditions • affects incentives to expand production supply of bonds (shift rt.) exp. profits • exp. economic expansion shifts bond supply rt.
a change in expected inflation • rising inflation decreases real cost of borrowing supply of bonds (shift rt.) exp. inflation
Bond Demand • bond buyers/ lenders/ savers • look at Qd as a function of bond price/yield
Bond yield Qd of bonds • so bond demand slopes down with respect to price price of bond Qd of bonds
D Bond price Quantity of bonds
Changes in bond price/yield • Move along the bond demand curve • What shifts bond demand?
Wealth • Higher wealth increases asset demand • Bond demand increases • Bond demand shifts right
P D D Qd
a change in expected inflation • rising inflation decreases real return inflation expected to demand for bonds (shift left)
a change in exp. interest rates • rising interest rates decrease value of existing bonds int. rates expected to demand for bonds (shift left)
a change in the risk of bonds relative to other assets relative risk of bonds demand for bonds (shift left)
a change in liquidity of bonds relative to other assets relative liquidity of bonds demand for bonds (shift rt.)
Bond market equilibrium • changes when bond demand shifts, and/or bond supply shifts • shifts cause bond prices AND interest rates to change
Example 1: the Fisher effect • expected inflation 3%
exp. inflation rises to 4% • bond demand -- real return declines -- Bd decreases • bond supply -- real cost of borrowing declines -- Bs increases
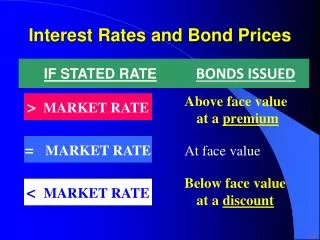
bond price falls • interest rate rises
Fisher effect • expected inflation rises, nominal interest rates rise
bond demand • decline in income, wealth • Bd decreases • P falls, i rises • bond supply • decline in exp. profits • Bs decreases • P rises, i falls