Effective Requirements Analysis for System Development | Movie.Video Rental Example
Understand the importance of requirements analysis in IS development, including ERD and critical techniques. Explore the conceptual model of a video rental database at MovieClub to grasp essential information and eliminate redundant details. Learn the impact of incorrect analysis and benefit from fact-finding techniques for precise system development.


Effective Requirements Analysis for System Development | Movie.Video Rental Example
E N D
Presentation Transcript
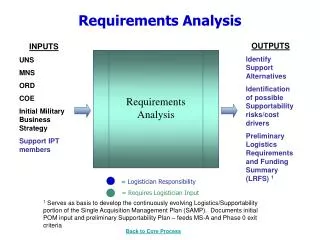
Requirements Analysis • One of the early IS development phases. • ERD: part of requirements analysis phase • The process and technique that a group of system analyst uses to identify, analyze, and understand system requirements • System’s requirements specify what the information system must do, or what property or quality the system must have. • What do bank tellers need and want from the new or renovated system? • Critical phase for reducing the system cost
Requirements Analysis for RDS • Identify essential information • Remove redundant, unimportant details • Clarify unclear natural language statements • Distinguish data and operations • Data: ERD (entity relationship diagram) • Operation: DFD (data flow diagram) • Example: Movie Video Rental (next slide)
Example: Movie Video Rental • MovieClub is a video rental store that has a variety of films for every age group. The manager of the club has a database application installed to manage the store more efficiently. The database application supports the main business operations in the store, namely, video checkout and return, inventory management, and membership management. It is also used to answer possible customer queries about the availability of certain films. The following is a description of the conceptual model of the video rental database at MovieClub. • The video rental database contains information about members, films, video tapes, and rentals. The information on members includes the name, address, phone number, and the expiration date of the membership. A member is identified with a unique membership number.
Example con’t • Films have identification numbers and are described by title, length (in minutes), category (drama, comedy, action, sci-fi, etc.), version (English, French, Spanish), and production date. There are usually several video tapes of each film. Every video tape is identified by a unique tape identification. Other information kept in the database about the tape includes type (VHS or DVD), and the rate at which in can be rented. • A member can rent several video tapes at the same time. Obviously, the same video tape can be rented by several members on different dates. Tape rental information, represented in the database, consists of checkout date, and duration (in days). It is important to notice that the same video tape can be rented by the same member more than once.
Essential information • customers, tapes, movies, ... • movies have many copies • tape (or DVD) contains exactly one movie • several video tapes of each film • identification (id)
Redundant, unimportant details • ….”manager of the club has a database application installed to manage the store more efficiently….” (unimportant) • ..”same video tape can be rented by several members..” (redundant) • A member can rent several video tapes at the same time. • DVDs on shelf (we do not design a tape robot!) • Names of the categories (maybe not now! But later)
5 4 3 COSTS 2 1 0 Relative Cost to Fix an Error (BASED ON CONSULTANT REPORTS & TRADE LITERATURE) ANALYSIS AND DESIGN POSTIMPLELENTATION CONVERSION PROGRAMMING
Results of Incorrect Requirements Analysis • The system may cost more than projected • The system may be delivered later than promised. • The system may not meet the users’ expectations and that dissatisfaction may cause them not to use it. • Once in production, the costs of maintaining and enhancing the system may be excessively high.
Very Difficult to Manage • Over the lifetime of the project, it is very common for new requirements to emerge and existing requirements to change. • Studies have shown that over the life of a project as much as 50 percent or moreof the requirements will change before the system is put into production.
Fact-Finding Technique • Sampling of existing documentation, forms, and databases. • Research and site visits. • Observation of the work environment. • Questionnaires. • Interviews. • Prototyping. • Joint requirements planning (JRP).
System Development Documentation • Data model becomes an official blue print (system document) of the DB • Department of Justice • See the Department of Justice documentation on the course website • System development is about “documentation….. Documentation…… documentation”
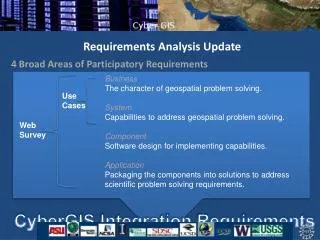
IS Architecture • Can be divided into data and process architectures • Data architecture by Data Model • ERD: focus on the optimal organization of data, not on where or how data are used • Process architecture by Process Model • DFD (Data Flow Diagram): focus on how and when data are moved • Diagram for IS architecture • UCD (Use Case Diagram)
What is Use Case Diagram? • The UCD is for the modeling of real-world objects and systems. • It is a graphic depiction of the interactions between stakeholders and a system • Focus on “What a system does”…”rather than how a system does.” • In other words, it is a methodology used in system analysis to identify, clarify, and organize OVERALL SYSTEM REQUIREMENTS.
UCD for Bank ATM http://www.uml-diagrams.org/bank-atm-uml-use-case-diagram-example.html?context=uc-examples
Creating Data Flow Diagram Lemonade Stand Example
Creating Data Flow Diagrams Example Steps: The operations of a simple lemonade stand will be used to demonstrate the creation of data flow diagram. • Create a list of activities • Construct Context Level DFD(identifies sources and sink) • Construct Level 0 DFD (identifies manageable sub processes ) • Construct Level 1- n DFD (identifies actual data flows and data stores )
Creating Data Flow Diagrams Example • Create a list of activities Think through the activities that take place at a lemonade stand. Customer Order Serve Product Collect Payment Produce Product Store Product Order Raw Materials Pay for Raw Materials Pay for Labor
Creating Data Flow Diagrams Example • Construct Context Level DFD(identifies sources and sink) Create a context level diagram identifying the sources and sinks (users). Context Level DFD Sales Forecast CUSTOMER 0.0 Lemonade System EMPLOYEE Order Production Schedule Customer Order Serve Product Collect Payment Produce Product Store Product Order Raw Materials Pay for Raw Materials Pay for Labor Product Served Pay Payment Time Worked Received Goods Payment Purchase Order VENDOR
Creating Data Flow Diagrams Example • Construct Level 0 DFD (identifies manageable sub processes ) Create a level 0 diagram identifying the logical subsystems that may exist. Level 0 DFD 1.0 Sale Sales Forecast Customer Order Customer Order Serve Product Collect Payment Produce Product Store Product Order Raw Materials Pay for Raw Materials Pay for Labor Product Ordered Payment CUSTOMER 2.0 Production EMPLOYEE Production Schedule Product Served Inventory Received Goods VENDOR 3.0 Procure-ment Purchase Order Order Decisions Payment Pay Time Worked 4.0 Payroll
Creating Data Flow Diagrams Example • Construct Level 1- n DFD (identifies actual data flows and data stores ) Create a level 1 decomposing the processes in level 0 and identifying data stores. Level 1 DFD CUSTOMER Customer Order Request for Forecast Customer Order Serve Product Collect Payment Produce Product Store Product Order Raw Materials Pay for Raw Materials Pay for Labor ORDER 1.1 Record Order 1.3 Produce Sales Forecast Severed Order Payment Sales Forecast 1.2 Receive Payment PAYMENT
Process Decomposition 1.0 Sale 1.1 Record Order 1.2 Receive Payment 2.0 Production 2.1 Serve Product 2.2 Produce Product 2.3 Store Product 0.0 Lemonade System 3.0 Procure-ment 3.1 Produce Purchase Order 3.2 Receive Items 3.3 Pay Vendor 4.0 Payroll 4.1 Record Time Worked 4.2 Calculate Payroll 4.3 Pay Employee Context Level Level 0 Level 1
Why not using Flow Chart? • Complex Logic: • Many of today’s IS program logic is quite complicated. In that case, flowchart becomes complex and clumsy because the complexity can grow exponentially. • Not so recommendable in MIS & CS • Alterations and Modifications: • If alterations are required the flowchart may require re-drawing completely. This is quite time and effort-consuming.
Why not using Flow Chart? • Reproduction: • As the flowchart symbols cannot be typed, reproduction of flowchart becomes a problem. • The essentials of what is done can easily be lost in the technical details of how it is done. • Factors that affect the sequence are not included.
How to develop IS Architecture? • How the foundation of IS architecture should be developed? • IS architecture • IS Strategy • Corporate Strategy • Strategic Management • Mission statement: root of strategic Mngt.
Strategic Management • Highest level of overall planning • is the continuous planning, monitoring, analysis and assessment of all that is necessary for an organization to meet its goals & objectivesand to position a firm to succeed in its market environment.
Strategic Management Process (con’t) Components of Strategic Management Process • Strategic Management Process(4:35) • Website: Strategic Management Process