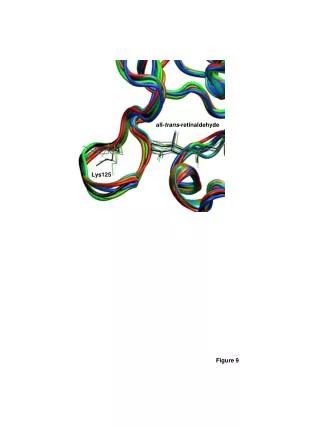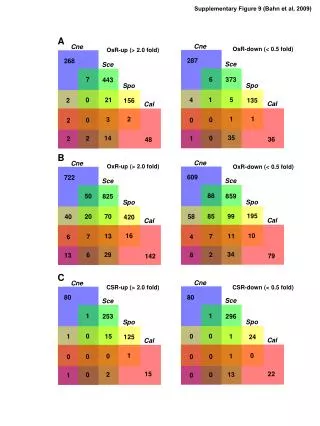

Figure 9.
E N D
Presentation Transcript
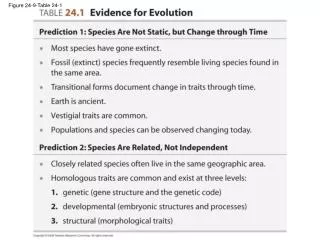
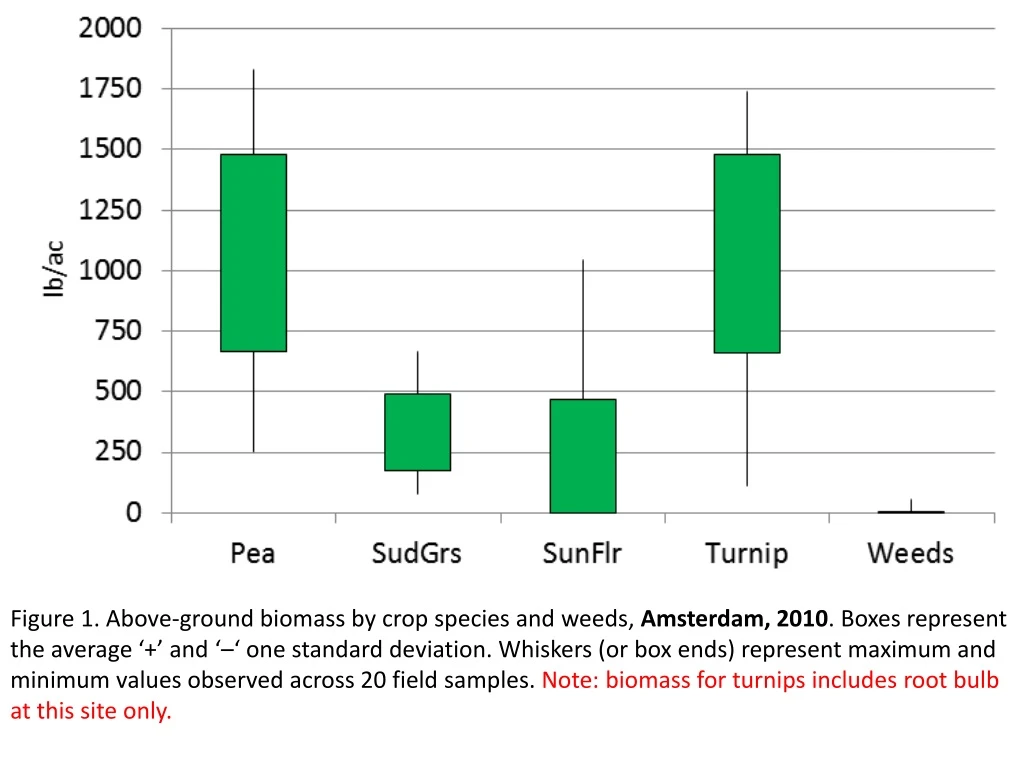
Figure 1. Above-ground biomass by crop species and weeds, Amsterdam, 2010. Boxes represent the average ‘+’ and ‘–‘ one standard deviation. Whiskers (or box ends) represent maximum and minimum values observed across 20 field samples. Note: biomass for turnips includes root bulb at this site only.
Figure 2. Above-ground biomass by crop species and weeds, Amsterdam, 2012. Boxes represent the average ‘+’ and ‘–‘ one standard deviation. Whiskers (or box ends) represent maximum and minimum values observed across 12 field samples. Note: above-ground portion of turnip bulb harvested.
Figure 3. Above-ground biomass by crop species and weeds, Conrad, 2012. Boxes represent the average ‘+’ and ‘–‘ one standard deviation. Whiskers (or box ends) represent maximum and minimum values observed across 12 field samples. Note: above-ground portion of all roots harvested (i.e. turnip).
Figure 4. Above-ground biomass by crop species and weeds, Dutton, 2012. Boxes represent the average ‘+’ and ‘–‘ one standard deviation. Whiskers (or box ends) represent maximum and minimum values observed across 12 field samples. Note: above-ground portion of all roots harvested (i.e. turnip, radish).
Figure 5. Above-ground biomass by crop species and weeds, Conrad, 2013. Boxes represent the average ‘+’ and ‘–‘ one standard deviation. Whiskers (or box ends) represent maximum and minimum values observed across 10 field samples. Note: above-ground portion of all roots harvested (i.e. turnip, radish).
Figure 6. Above-ground biomass by crop species and weeds, Dutton, 2013. Boxes represent the average ‘+’ and ‘–‘ one standard deviation. Whiskers (or box ends) represent maximum and minimum values observed across 12 field samples. Note: above-ground portion of all roots harvested (i.e. turnip, radish).
Figure 7. Above-ground biomass by crop species and weeds, Fort Benton, 2013. Boxes represent the average ‘+’ and ‘–‘ one standard deviation. Whiskers (or box ends) represent maximum and minimum values observed across 12 field samples. Note: above-ground portion of all roots harvested (i.e. turnip, radish). Note: foxtail millet and sorghum inadvertently mixed at biomass sampling.
Figure 8. Above-ground biomass by crop species and weeds, Great Falls, 2013. Boxes represent the average ‘+’ and ‘–‘ one standard deviation. Whiskers (or box ends) represent maximum and minimum values observed across 12 field samples. Note: above-ground portion of all roots harvested (i.e. turnip).
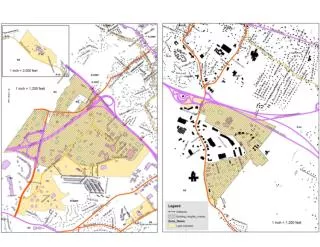
Figure 9. Hailed out winter wheat at Fort Benton, MT, June 19, 2014. Left image is cover crop area and right image is chem fallow. Note strong visual difference in drought stress. Pink blur in bottom right corner of each image is finger of amateur photographer Perry Miller.
Figure 10. Cover crop biomass by treatment at Amsterdam, MT, 2014.
Figure 11. Cover crop biomass by treatment at Contrad, MT, 2014.
Figure 12. Spring wheat yield following 2013 cover crop treatments at Dutton, MT, 2014. The Least Significant Difference (P<0.10) for yield is 5 bu/ac.
Figure 13. Spring wheat grain protein following 2013 cover crop treatments at Dutton, MT, 2014. The Least Significant Difference (P<0.10) for protein is 0.6%.