Measles Seroprofiles & Vaccine Coverage in 18 Countries (1996-2004)
Explore seroprofiles for measles in 18 countries from 1996 to 2004, along with vaccine coverage at 24 months and scheduled doses. Check the percentage positive/equivocal with 95% confidence intervals.

Measles Seroprofiles & Vaccine Coverage in 18 Countries (1996-2004)
E N D
Presentation Transcript
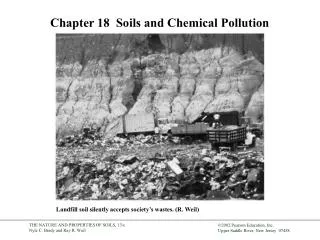
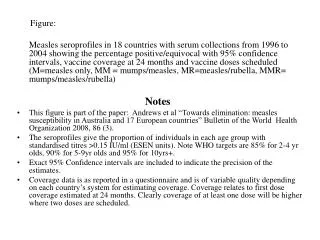
Figure: Measles seroprofiles in 18 countries with serum collections from 1996 to 2004 showing the percentage positive/equivocal with 95% confidence intervals, vaccine coverage at 24 months and vaccine doses scheduled (M=measles only, MM = mumps/measles, MR=measles/rubella, MMR= mumps/measles/rubella) Notes • This figure is part of the paper: Andrews et al “Towards elimination: measles susceptibility in Australia and 17 European countries” Bulletin of the World Health Organization 2008, 86 (3). • The seroprofiles give the proportion of individuals in each age group with standardised titres >0.15 IU/ml (ESEN units). Note WHO targets are 85% for 2-4 yr olds, 90% for 5-9yr olds and 95% for 10yrs+. • Exact 95% Confidence intervals are included to indicate the precision of the estimates. • Coverage data is as reported in a questionnaire and is of variable quality depending on each country’s system for estimating coverage. Coverage relates to first dose coverage estimated at 24 months. Clearly coverage of at least one dose will be higher where two doses are scheduled.