Download

1 / 21
220 likes | 390 Vues
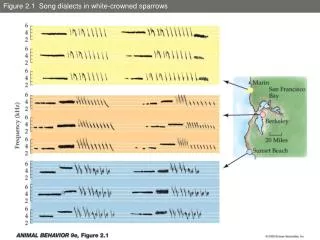
Figure 16.1 Paul Romer (1955– ). Figure 16.2 A complete world. Figure 16.3 New goods and variety. Figure 16.4 Quality ladders. Figure 16.5a USA; GDP per capita, international 1990 G-K dollars. Figure 16.5b France, share of income invested.

E N D
Figure 16.5a USA; GDP per capita, international 1990 G-K dollars
Figure 16.6 Steady state equilibrium in the neoclassical growth model
Figure 16.7 ‘Explained’ growth & Solow residual. (a) USA ‘explained’ economic growth (%)
Figure 16.7 ‘Explained’ growth & Solow residual. (b) USA actual growth & Solow residual
Figure 16.11 Evolution of agglomeration, the Herfindahl index
Figure 16.13 Economic structure in France and the USA, 1970-2003
Figure 16.13 Economic structure in France and the USA, 1970-2003
Figure 16.14 Economic structure in Brazil, China, and India, 1960-2003
Figure 16.14 Economic structure in Brazil, China, and India, 1960-2003
Figure 16.14 Economic structure in Brazil, China, and India, 1960-2003