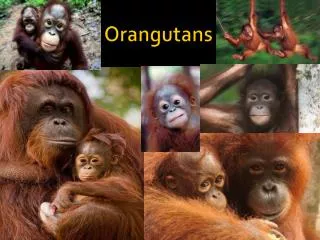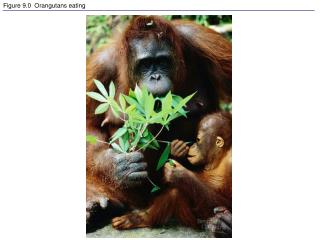
Figure 9.0 Orangutans eating
630 likes | 993 Vues
Figure 9.0 Orangutans eating. Figure 9.1 Energy flow and chemical recycling in ecosystems. Figure 9.x1 ATP. Figure 9.2 A review of how ATP drives cellular work. Figure 9.3 Methane combustion as an energy-yielding redox reaction. Figure 9.4 NAD + as an electron shuttle.

Figure 9.0 Orangutans eating
E N D
Presentation Transcript
Figure 9.3 Methane combustion as an energy-yielding redox reaction
Figure 9.9 A closer look at glycolysis: energy investment phase (Layer 1)
Figure 9.9 A closer look at glycolysis: energy investment phase (Layer 2)
Figure 9.9 A closer look at glycolysis: energy payoff phase (Layer 3)
Figure 9.9 A closer look at glycolysis: energy payoff phase (Layer 4)
Figure 9.10 Conversion of pyruvate to acetyl CoA, the junction between glycolysis and the Krebs cycle
Figure 9.15 Chemiosmosis couples the electron transport chain to ATP synthesis
Figure 9.16 Review: how each molecule of glucose yields many ATP molecules during cellular respiration
Figure 10.2 Focusing in on the location of photosynthesis in a plant
Figure 10.4 An overview of photosynthesis: cooperation of the light reactions and the Calvin cycle (Layer 1)
Figure 10.4 An overview of photosynthesis: cooperation of the light reactions and the Calvin cycle (Layer 2)
Figure 10.4 An overview of photosynthesis: cooperation of the light reactions and the Calvin cycle (Layer 3)
Figure 10.6 Why leaves are green: interaction of light with chloroplasts
Figure 10.8 Evidence that chloroplast pigments participate in photosynthesis: absorption and action spectra for photosynthesis in an alga
Figure 10.9 Location and structure of chlorophyll molecules in plants
Figure 10.12 How noncyclic electron flow during the light reactions generates ATP and NADPH (Layer 1)
Figure 10.12 How noncyclic electron flow during the light reactions generates ATP and NADPH (Layer 2)