“Perfmon and Profiler 101 - Performance Tuning Secrets Revealed!”
460 likes | 481 Vues
Explore the world of performance tuning with Brent Ozar, a former SQL DBA and expert in SQL Server from Quest Software. Learn about tools such as Perfmon for capturing metrics, trace analysis with Profiler, and effective mitigation strategies. Discover how to interpret metrics, analyze trace data, and implement solutions to optimize system performance. Uncover performance issues, mitigate problems, and fine-tune your SQL Server environment for optimal efficiency.

“Perfmon and Profiler 101 - Performance Tuning Secrets Revealed!”
E N D
Presentation Transcript
About Me: Brent Ozar • SQL Server Expert for Quest Software • Former SQL DBA • Managed >80tb SAN, VMware • Dot-com-crash experience • Specializes in performance tuning
Today’s Agenda • The Honda Civic and the Nissan GT-R • Metrics, Trace, Mitigations • A New Secret Weapon • Resources and Q&A
If You Don’t Need to Go Fast… From http://flickr.com/photos/stevekeys/2755142278/
Two Approaches to Detection • Exceptions Monitoring: Check Engine • Proactive Monitoring: Detailed Gauges
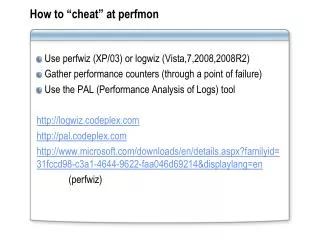
Capture Metrics With Perfmon • Performance Monitor, aka Perfmon • Ships with all Windows versions • Polls any server from your desktop • Pulls performance metrics • Writes them to a file • Requires some OS permissions • Does not include alerts or analytics
Memory Counters • Memory – Available Mbytes • Paging File - % Usage • SQLServer:Buffer Manager – • Buffer cache hit ratio • Page life expectancy • SQLServer:Memory Manager – Memory Grants Pending
Storage Metrics: Physical Disk • % Disk Time • Avg. Disk Queue Length • Avg. Disk sec/Read • Avg. Disk sec/Write • Disk Reads/sec • Disk Writes/sec
CPU Metrics • Processor - % Processor Time • System – Processor Queue Length • SQLServer:General Statistics – User Connections (not CPU, just “other”)
What To Look For, In Order • System – Processor Queue Length • Memory – Available Mbytes • Lock pages in memory!
What To Look For Next • Disk metrics on the page file drive • Disk metrics on the log file drive • Disk metrics on the data file drive • Disk metrics on the TempDB drive
Got Everything on One Drive? • Narrow it down with the DMV sys.dm_io_virtual_file_stats
Columns to Capture What’s Going On What The Impact Was CPU Reads Writes Duration Start Time End Time • Text Data • DatabaseID and/or DatabaseName • Login Name • Host Name • Application Name
Correlate Metrics & Trace • Show a cause and effect relationship • Fields to mentally “join” on: • Date/Time ranges • CPU • Reads/Writes • Duration
Sample Problem #1 • Metrics tell us: • Very high disk queue lengths on data drive • Trace tells us: • Report queries doing table scans w/o indexes • Many scheduled reports run simultaneously
Ways We Can Mitigate It • Add covering indexes • Modify existing indexes • Run reports serially, not all at once • Add hard drives to the data file array • Add memory to cache scanned tables
Sample Problem #2 • Metrics tell us: • Page file drive queue lengths average >20 • Page file use averages >1% • Available memory averages <200mb • Buffer cache hit ratio andpage life expectancy are high • Trace tells us: • No unusual queries
Ways We Can Mitigate It • Add memory and enable AWE/PAE • Add memory and upgrade to 64-bit • Reduce SQL’s min/max memory sizes • Move the app to its own server
Sample Problem #3 • Metric looks OK, but every 15 minutes: • Long drive queues on the log file drive • Page life expectancy drops near zero • Network traffic jumps • Trace tells us: • Transaction log backups are running
Ways We Can Mitigate It • Stop doing log backups • Put the databases in simple mode • Add drives to the transaction log array • Throttle the transaction log backups
Sample Problem #4 • Metrics tell us: • CPU average is high • Disk, memory look OK • Trace tells us: • Queries are using cursors • Operating on individual records, not sets
How We Can Mitigate It • Change cursor to set-based query • Buy really fast processors • Spend a lot on licensing
Wrapping Things Up • Double-check the event log first • Don’t get overwhelmed: focus with the Metric – Trace – Mitigation process • Show a clear cause and effect • Use cloud-based BI to get an edge
Resources On The Web • My posts about Perfmon and analytics:www.BrentOzar.com/perfmonwww.BrentOzar.com/perfmoncloud • Excel Table Analysis Tools for the Cloud:www.SQLServerDataMining.com/cloud • SQL Server community:SQLServerPedia.com