Download
1 / 12
120 likes | 130 Vues
Explore the devolved model of local democracy in Coromandel, NZ, empowering residents to manage local matters. Learn about the goals, impacts, and challenges faced in implementing this innovative approach.

E N D
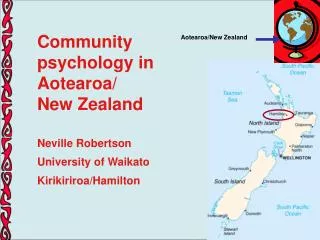
Coromandel New Zealand: Community Empowerment in Council decision-making The most devolved model of local democracy in NZ
27,000 population 27,000 properties 55% property owners live out-of-district Council Opex: $84M Council staff: c.200 Tourism Coromandel Location Aquaculture Retirement Auckland Coromandel Peninsula FACTS
Representation • Coromandel-Colville Ward • 1 Councillor • 4 Community Board Members • NZ has 2 tiers of Govt: • Central Govt • Regional & Local Govt (same tier; diff. functions) • Mercury Bay Ward • 2 Councillors • 4 Community Board Members Mayors in NZ TLAs are voted at large • South-Eastern Ward • 2 Councillors • 2 Community Boards with 4 Members: • Thames Ward • 3 Councillors • 4 Community Board Members Tairua-Pauanui Community Board Whangamata Community Board
TCDC Council Model • Our Belief: Local people best to manage local matters; • Who is ‘Local’? People at Community Board level; • Defined: ‘Essential’ services vs ‘Local’ services; • Devolved: Service delivery, levels of service, budget & decision-making, revenue methods; • Leadership: We unified local and district leadership; • Administration: We increased resourcing to local level.
Localism “We think that power should be exercised at the lowest practical level – close to the people affected by decisions, rather than distant from them.” (UK: Rt. Hon. Greg Clark, 2010) “When you are talking about localism in NZ you are running against a deep-seated ideology, and it is one of the reasons why localism has not made a lot of traction. The good news is: Statism has peaked.” (NZ: Rt. Hon. Bill English, in Hartwich 2013)
Empowerment Goals • Local people making decisions over local issues and services that effect their lives; • Faster decision-making; • To stop the ‘one size fits all’ culture of central silos; • Cost savings through local innovation; • Faster local economic development; • To grow local leadership; • Better community planning; • Bring empathy and ‘the local’ back into staff culture across all parts of council. Whangamata Area Office where the model was birthed
Cost savings through local innovation example– Mercury Bay • Harbour Pontoon Project Carpark charging Pontoon Decision Challenged by: “The Think Feel Tank Team of the People of Whitianga NZ” Community Board Decision challenge: Presented 22pp of stat tests including the ‘Kolmogorov-Smirnov test’
Endorsement • “In my view, more 'local' projects have been completed under the first year of Community Empowerment, with contemporaneous reductions in rates, than had been completed in several prior years of convoluted and expensive bureaucracy." • Keith Johnson • Whangamata Community Board Chair
Cost impacts on debt • External Debt Tracking: • (Change of Model was in 2011/12) 2012 2009 Actual Spend
Endorsements • “The doomsayers told us we would be crippled by personal grievances, our services would collapse and communities would send rates sky-high wanting every project under the sun. • “It was a hell of a big change to staff but we weren't crippled by personal grievances. The next year, in 2013, we had the highest ever public satisfaction with many of our main services, and average total rates dived to the lowest per property in the Waikato in 2013 as our costs came under control." • Mayor Glenn Leach • TCDC
Cost impacts on property tax • Rates Tracking: • (Change of Model was in 2011/12) 2012 2009 Actual average Rates per property
Change In practice • Restructure prompted • Council culture challenged • Full commitment required • Principles (if not the Model) transposable • Innovation unleashed locally • Cost restraint enhanced • Public satisfaction improved • Still a work in progress in 2015