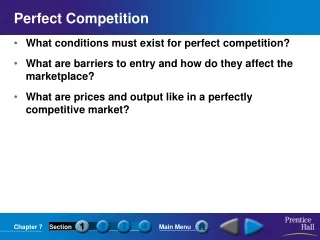
Perfect Competition
Perfect Competition. Equilibrium Q D = Q S Ex: Q D = 13 - .2P Q S = .4P-2 Find equilibrium price and quantity. Perfect Competition. Equilibrium Q D = Q S 13 - .2P = .4P-2 15 = .6P P = 25 Q = 8 . Perfect Competition. Shift in Demand


Perfect Competition
E N D
Presentation Transcript
Perfect Competition Equilibrium QD = QS Ex: QD = 13 - .2P QS = .4P-2 Find equilibrium price and quantity
Perfect Competition Equilibrium QD = QS 13 - .2P = .4P-2 15 = .6P P = 25 Q = 8
Perfect Competition Shift in Demand Here, demand increase, shifted demand curve to right, increasing PE and QE.
Perfect Competition Shift in Supply Here, supply increase, shifted supply curve to right, decreasing PE and increasing QE.
Characteristics • Large number of sellers • So many that one firm cannot impact market • No barriers to entry or exit • Firms can enter when economic profits are positive, and exit when negative. • Homogeneous products • Firms compete only with price, and consumers have perfect information. Goods are perfect substitutes. • Sellers are price takers • Can sell all they want at market price. • 5. Demand is perfectly elastic. • P = MR = D
Profit Max • Perfectly competitive firms profit maximize at MC = MR • Since D = MR = P, profit max is where P = MC • Firms’ short run supply curve is portion of MC curve lying above AVC curve (why not the portion below AVC?)
Derive Supply Curve • Derive supply curve from cost function: • C = 25 – 4Q + Q2. • Write an equation for the firm’s supply curve: • MC = P = 2Q – 4, so QS = P/2 +2 • Assuming 40 firms in market, write equation for market supply curve: • QS = 40(P/2 + 2) = 20P + 80
Profit Max Paradox • When a PC firm earns positive economic profit in the short run, with no barriers to entry, other firms will enter the market, pushing price down until all economic profits are gone. • The simultaneous pursuit of maximum profit by competitive firms results in zero economic profits and minimum –cost production for all firms in the market.
Using Cost Information • In the PC market described on slide #9, what is equilibrium price and output in the long run?(Hint: Find the typical firm’s minimum average cost by setting AC = MC). • Let industry demand be QD = 320-20P. Find total output in the long run. • How many firms can support the market?
Using Cost Information • In the PC market described on slide #9, what is equilibrium price and output in the long run?(Hint: Find the typical firm’s minimum average cost by setting AC = MC). • C = 25 – 4Q + Q2 • MC = 2Q – 4 • ATC = 25/Q – 4 + Q • 2Q – 4 = 25/Q – 4 + Q • 25/Q = Q • Q = 5 (in thousands) • P = Min ATC = 25/5 – 4 + 5 = $6
Using Cost Information • Let industry demand be QD = 320-20P. Find total output in the long run. • QD = 320-20P = 320 – 20(6) = 200 • How many firms can support the market? • 200/5 = 40 firms