Development of the glider system
170 likes | 360 Vues
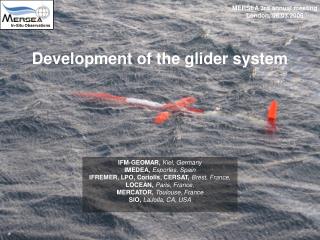
MERSEA 3rd annual meeting London, 06.03.2006. In-Situ Observations. Development of the glider system. IFM-GEOMAR, Kiel, Germany IMEDEA, Esporles, Spain IFREMER, LPO, Coriolis, CERSAT, Brest, France, LOCEAN, Paris, France, MERCATOR, Toulouse, France SIO, LaJolla, CA, USA.

Development of the glider system
E N D
Presentation Transcript
MERSEA 3rd annual meeting London, 06.03.2006 In-Situ Observations Development of the glider system IFM-GEOMAR, Kiel, Germany IMEDEA, Esporles, Spain IFREMER, LPO, Coriolis, CERSAT, Brest, France, LOCEAN, Paris, France, MERCATOR, Toulouse, France SIO, LaJolla, CA, USA
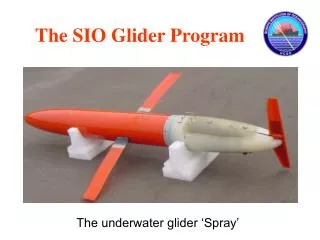
Autonomous Underwater Gliding Vehicle (AUGVs): GLIDERS • Gliders are driven by positive and negative buoyancy createdby a change in volume. No propeller is required. • Wings convert vertical velocity into forward velocity. • Glide downward when denser than surrounding water and upward when buoyant, in a sawtooth pattern. Slocum Webb Research Corp. Spray Scripps Institution of Oceanography Seaglider APL-University of Washington change of buoyancy andcontrol of internal mass distribution induced vertical velocity, and control of roll and pitch forward movements
Autonomous Underwater Gliding Vehicle (AUGVs): GLIDERS Coriolis Data Center IFREMER Brest, France Numerical Models Mercator, MFS, ... Ground Station IFM-GEOMAR Kiel, Germany U ~ 20-40 cm/s W ~ 10-20cm/s 1km ~2-5 km between surfacings
MERSEA gliders Mediterranean Sea WP3.5: assessment of available long-range glider technologies which meet MERSEA requirements Development of the glider system: • Collection of Physical and Biogeochemical Data during the TOP phase • Data Flow and Quality Control • Data Assimilation • Next operations Slocum glider Webb Research Corporation North Atlantic Ocean Spray glider Scripps Institution of Oceanography
Mediterranean Sea Virtual mooring off Mallorca Operations with 2 Slocums 1) Development of user-fitted lithium batteries for better endurance (x3) Tests during a “virtual mooring“ mission. ~120 profiles (0-1000m, end of Sept. 2005) 2) Trials in coastal environment (0-200m) Poster WP3.5 Potential temperature To be continued... 21.09.2005 02.10.2005
North Atlantic Ocean – TOP phase Press releases for MERSEA Ouest-France Telegramme Preparation at Ifremer (Brest) Deployment from the Argonaute (SHOM) on the 05.12.2005 - still active! Glider survey around PAP (MERSEA multidisciplinary mooring) + • Proven ~3-months endurance • (> 2300 km horiz.) • Carried out ~450 dives to 1000m • measurements of • Salinity, • Temperature, • Fluorescence (Chl), • Currents averaged • over 0-1000m (green arrows).
North Atlantic Ocean Pot. temperature Chl Pot. Density Salinity 5 Dec. 2005 - now ~450 profiles to 1000m [5 profiles/day] Vertical res. ~ 3 m Horiz res. ~ 3-5 km All profiles in grey. Last profiles in color. [n=last profile] n, n-1, n-2, n-3, n-4, n-5, n-6
North Atlantic Ocean ~ 2300 km - 3 months Mixed layer depth Potential temperature along the glider trajectory Large scale: water mass characteristics and distribution, mixed layer evolution Mesoscale (~50 km): fronts, eddies Small scale (~3-5km): oscillations, filaments – “subgrid phenomena“ Physical constraints on numerical models
North Atlantic Ocean 80 km U ~ 30cm/s + PAP Potential temperature along the glider trajectory Large scale: water mass characteristics and distribution, mixed layer evolution Mesoscale (~50 km): fronts, eddies Small scale (~3-5km): oscillations, filaments – “subgrid phenomena“ Physical constraints on numerical models
North Atlantic Ocean + PAP Potential temperature along the glider trajectory Large scale: water mass characteristics and distribution, mixed layer evolution Mesoscale (~50 km): fronts, eddies Small scale (~3-5km): oscillations, filaments – “subgrid phenomena“ Physical constraints on numerical models
North Atlantic Ocean Salinity along the glider trajectory Large scale: water mass characteristics and distribution, mixed layer evolution Mesoscale (~50 km): fronts, eddies Small scale (~3-5km): oscillations, filaments – “subgrid phenomena“ Physical constraints on numerical models
North Atlantic Ocean Fluorescence (Chl) along the glider trajectory Large scale: biological acitivity (mainly mixed layer), vertical distribution/integral Mesoscale (~50 km): local modulations Small scale (~3-5km): diurnal cycle, filaments Vertical integral = bio-activity in the mixed layer validation elements for coupled physical-biogeochemical models
Glider Control from Land Monitoring the health of the glider (Voltage, pump time, waypoints, comms...) Remote steering with information from: 1) model analyses/forecasts 2) satellite imagery MERCATOR - SSH “Glider Routing“ in development: use of a glider simulator in NRT to forecast glider trajectories << better steering >> AVHRR - SST
Data Access http://www.ifm.uni-kiel.de/fb/fb1/po2/research/mersea/gliders/spray004_position.html Mersea In-Situ Portal data visualization http://www.coriolis.eu.org/cdc/dataSelection/cdcDataSelections.asp Coriolis data selection website data visualization and download Coriolis ftp server
Quality Control and Metadata QC procedures at Coriolis like for profiling floats. Profiles are considered as vertical. - T and S outsiders based on historical data - Density inversions are rejected + visual inspection Metadata: Vehicle name, project, PI Waypoint (heading) Angle of ascent/descent Target depth Climb depth Target altitude Time between surfacing Current correction Dive #260 – “dirt“ in the conductivity cell
Assimilation of glider data Temperature differences between MERCATOR North Atlantic 1/15° and the in-situ observations glider Before data assimilation After data assimilation The model trajectory is modified by the data assimilation process, to better fit the observations. development required to better assimilate in-situ data at the moment: correlation criteria for profiling floats 1 profile per 1°x1° per week >> in progress
Achievements and Plans Demonstrated 1) Steering possibility 2) Long endurance 3) Near real timephysical and biogeochemicaldata 4) High density and resolution of the measurements 5) Continuous measurements 6) Impact on operational numerical products Next operations - Deployments in the Western Mediterranean end of March - Deployments in the North Atlantic 1) Maintain surveys around PAP recovery/redeployment 2) Similar survey around CIS June-Sept 2006