Download
1 / 5
60 likes | 218 Vues
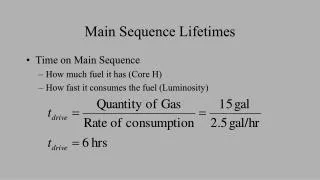
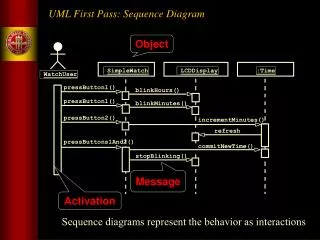
This document presents a comprehensive UML sequence diagram detailing the interactions between a WatchUser and the SimpleWatch during various time-setting operations. It illustrates the button-press sequences to blink hours and minutes, increment time, and commit new settings. Additionally, the statechart diagram exemplifies the internal state transitions of the watch based on user actions. Both diagrams serve as key tools in refining use case descriptions and subsystem interfaces during requirements analysis and system design processes, aiding in the development of an efficient time management system.

E N D
:SimpleWatch :LCDDisplay :Time UML First Pass: Sequence Diagram Object :WatchUser pressButton1() blinkHours() pressButton1() blinkMinutes() pressButton2() incrementMinutes() refresh() pressButtons1And2() commitNewTime() stopBlinking() Message Activation Sequence diagrams represent the behavior as interactions
Increment Hours Increment Minutes Increment Seconds UML First Pass: Statechart Diagrams Initial state State Event button2Pressed button1&2Pressed Blink Hours Transition button1Pressed button2Pressed button1&2Pressed Blink Minutes button1Pressed button1&2Pressed button2Pressed Blink Stop Seconds Blinking Final state
Used during requirements analysis To refine use case descriptions to find additional objects (“participating objects”) Used during system design to refine subsystem interfaces Classes are represented by columns Messages are represented by arrows Activations are represented by narrow rectangles Lifelines are represented by dashed lines UML Sequence Diagrams TicketMachine Passenger selectZone() insertCoins() pickupChange() pickUpTicket()
UML Sequence Diagrams: Nested Messages ZoneButton TarifSchedule Display selectZone() lookupPrice(selection) price displayPrice(price) Dataflow • The source of an arrow indicates the activation which sent the message • An activation is as long as all nested activations …to be continued...
State Chart Example Waiting Requests finished (no further requests) Button press (other floor) Button press (same floor) Arrival at a request floor Moving Service floor (open doors) Button press Sample State Chart for an Elevator class