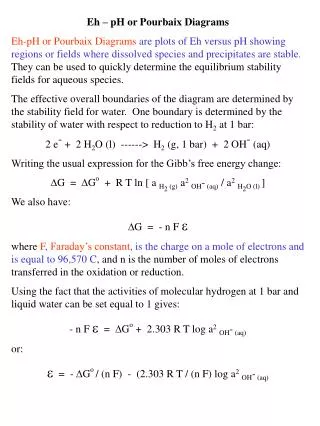
Eh-pH Diagrams
Eh-pH Diagrams. What Are These Things Again?. Eh–pH diagram: aka Pourbaix diagram, potential-pH diagram, electro-chemical phase diagram Invented in 1930’s by Marcel Pourbaix (Belgian)
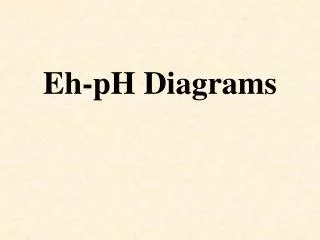

Eh-pH Diagrams
E N D
Presentation Transcript
What Are These Things Again? Eh–pH diagram: aka Pourbaix diagram, potential-pH diagram, electro-chemical phase diagram Invented in 1930’s by Marcel Pourbaix (Belgian) Used in lots of places: extractive metallurgy, corrosion (their original purpose), environmental engineering, geochemistry Closely tied to aqueous thermodynamics
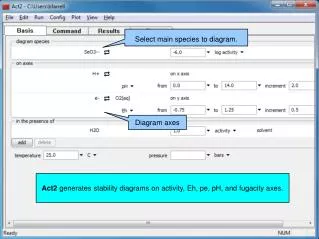
The Basics x-axis is pH; usually 0–14, but sometimes as low as –3, and sometimes up to 16 pH = –log [H+]; change of 1.0 pH unit changes [H+] by factor of 10 y-axis is electrode potential relative to SHE (range varies); positive is oxidiz-ing condition, negative is reducing Assumes constant temperature, aH2O = 1 Diagram is divided into predominance regions, where one phase prevails Requires definition of predominance in terms of chemical potential For solids, activity = 1; for gases, set a partial pressure; for solutions, set an activity
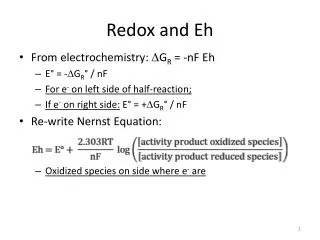
The Basics Two lines shown here are present on nearly all Eh-pH diagrams Line (a) is for 2 H+ + 2 e– = H2 (g) Usually presumes pH2 = 1 atm Since ΔG° = 0, applying Nernst equation, E = 0 – 0.05915 pH Result: E = 0 at pH = 0 (SHE), slope of straight line = –0.05915 When conditions are below line, reduction reaction generates H2 (g); when conditions are above line, H2 (g) oxidizes to H+ Line (b) is for 4 H+ + O2 + 4 e– = 2 H2O; E = 1.23 – 0.05915 pH Above line, oxidizing conditions generate O2; below line, reduction reaction generates H2O Most hydrometallurgical processes operate between the lines
Add A Metal Eh-pH diagram shows Cu–H2O system Dotted lines represent water stability region; solid lines represent equi-libria between copper species Two aqueous species, Cu2+ and CuO22- Oxidation state of Cu as Cu0 is 0 Oxidation state of Cu as Cu2O is +1 Oxidation state of Cu in Cu2+, CuO, and CuO22- is +2 Lower oxidation states are stable at bottom, higher oxidation states at top Activity of solid compounds = 1 when predominant; varies for aqueous species (1 in this case, could be as low as 10–6) Predominance activity determined by purpose, value of metal
More on Metal – H2O Diagrams Type of stable ion depends on pH For CuO + 2 H+ = Cu2+ + H2O, low pH drives reaction to right Simple ions like Cu2+ are stable at low pH For CuO + H2O = 2 H+ + CuO22–, high pH drives reaction to right Oxyions like CuO22– are stable at high pH Solid oxides, hydroxides most stable in center of diagram
More on Metal – H2O Diagrams Three kinds of lines separate copper species in this diagram First is vertical: CuO + 2 H+ = Cu2+ + H2O; CuO + H2O = CuO22– + 2 H+ Reactions involve exchange of H+, but no electrons (no oxidation/reduc-tion); independent of E Second type of line is horizontal: Cu2+ + 2 e– = Cu Reaction involves oxidation/reduction, but no H+; independent of pH Third type of line is diagonal: Cu2O + 2 H+ + 2 e– = 2 Cu + H2O Reaction involves both oxidation/reduction and H+ exchange, so line is a function of E and pH (No curved lines in most diagrams.)
Why Does This Matter? (Part I) Diagram at bottom left is Cu–H2O system Presence of stability region between lines for Cu and ions shows that Cu can be produced hydrometallurgically Diagram at bottom right is Au–H2O system No stability region for gold ions between lines; can’t dissolve Au in aqueous solutions (for now)
The Effect of Ion Activity Diagram shows Co–H2O system Tiny 0, –2, –4, –6 represent base-10 log of ion activity (Co2+, HCoO2–) As required activity of ions decreases, predominance area for ions grows (sideways and vertically) Easier to “produce” ions if desired concentration isn’t as high Easier to reduce ions to metal is con-centration of ions is higher
The Effect of Temperature Partial Eh-pH diagrams below show Cu–H2O system at 25° (left) and 100°C (Use log aCu(2+) = 0 lines for low–temperature diagram) Notice slight change in slope of diagonal lines Cu2+ region shrinks (unusual), Cu2O region is smaller, CuO and Cu regions ↑ Water stability region also moves Can use changes in temperature to our advantage
Eh-pH Diagrams for Anions Diagram shows S–H2O system at 25°C H2S is dissolved in solution, not gas Can do this for other anions as well Matters because pure oxide minerals are uncommon, and anions are used for leaching, precipitation; need the right one!
Why This Matters (Part II) Diagrams below show Au–H2O and Au–CN–H2O diagrams at 25°C Diagram at left shows why we can’t dissolve gold; diagram at right shows how we can (This is why cyanide is used) Notice vertical line at bottom for H+ + CN– = HCN (g); impacts other lines Also notice curvature of lines; reflects changing activity coefficients
Add An Anion And Another Metal (Hope you’re taking notes!) Diagram shows Cu–Fe–S–H2O sys-tem at 25°C Requires setting activity for aqueous Cu, Fe, and S species CuFeS2 is chalcopyrite, main copper mineral Cu5FeS4 is bornite FeS2 is pyrite; FeS is pyrrhotite Notice separate predominance regions for several species; impact of changing predominant S species
Why This Matters (Part III) Chalcopyrite contains copper ($3/lb) and iron ($0.08/lb). How to separate? Could smelt, oxidize iron to slag; re-quires energy, flux, slag disposal Why not leach? Where on this diagram can I put Cu into solution and leave Fe behind?
Limitations of Eh-pH Diagrams • Doesn’t include impact of kinetics • Presumes only one predominant species (sometimes activities of ions are nearly equal) • Depends on accurate thermodynamic data (not always available for complex compounds)
For More Information… • University of Montana Geology Department • http://www.umt.edu/geosciences/faculty/moore/G431/lectur7.htm • University of Idaho Geology Department • http://www.sci.uidaho.edu/geol464_564/Powerpoint/Lecture_9a_468_568nc.ppt