Download
1 / 22
910 likes | 2.54k Vues
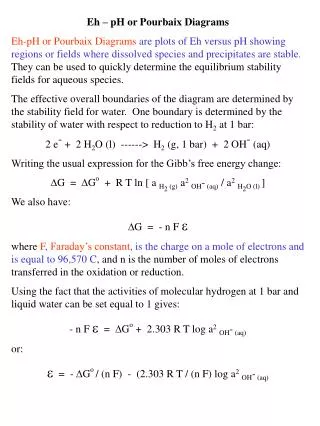
Eh – pH or Pourbaix Diagrams Eh-pH or Pourbaix Diagrams are plots of Eh versus pH showing regions or fields where dissolved species and precipitates are stable. They can be used to quickly determine the equilibrium stability fields for aqueous species.

E N D
Eh – pH or Pourbaix Diagrams Eh-pH or Pourbaix Diagrams are plots of Eh versus pH showing regions or fields where dissolved species and precipitates are stable. They can be used to quickly determine the equilibrium stability fields for aqueous species. The effective overall boundaries of the diagram are determined by the stability field for water. One boundary is determined by the stability of water with respect to reduction to H2 at 1 bar: 2 e- + 2 H2O (l) ------> H2 (g, 1 bar) + 2 OH- (aq) Writing the usual expression for the Gibb’s free energy change: DG = DGo + R T ln [ a H2 (g) a2OH- (aq) / a2H2O (l) ] We also have: DG = - n F e where F, Faraday’s constant, is the charge on a mole of electrons and is equal to 96,570 C, and n is the number of moles of electrons transferred in the oxidation or reduction. Using the fact that the activities of molecular hydrogen at 1 bar and liquid water can be set equal to 1 gives: - n F e = DGo + 2.303 R T log a2OH- (aq) or: e = - DGo / (n F) - (2.303 R T / (n F) log a2OH- (aq)
At 25 oC: • 2.303 R T / F = 2.303 (8.314 J/mol K) (298.15 K) / (96,486.8 C) • = 0.05917 V • Thus: • e = - DGo / (n F) - ( 0.05917 V / n ) log a2OH- (aq) • = - DGo / (2 F) - 2 ( 0.05917 V / 2 ) log a OH- (aq) • = - DGo / (2 F) - ( 0.05917 V ) log a OH- (aq) • = - DGo / (2 F) + ( 0.05917 V ) pOH • = - DGo / (2 F) + ( 0.05917 V ) ( 14.0 – pH ) • DGo can be calculated from standard tabulated Gibb’s free energies of formation at 298.15 K: • DGo = 2 DGo m,f, OH- (aq)- 2 DGo m,f, H2O(l) • = 2 ( - 157.300 kJ ) - 2 ( - 237.2 kJ ) • = + 159.8 kJ • e = - DGo / (2 F) + ( 0.05912 V ) ( 14.0 – pH ) • = - (+ 159.8 10+3 J) / (2 (96,570 C) ) + 0.8283 V • - ( 0.05911 V ) pH • = ~ 0 V - ( 0.05911 V ) pH
This equation can be plotted on an Eh-pH diagram to give one of the stablility boundaries for water: Below this line water is unstable with respect to reductive decomposition to H2 (g) at 1 bar of pressure. How would this line change, if the H2 (g) pressure were set at 10 bar or 0.1 bar?
With this background the stability boundary for the oxidative decompostion of water to O2 (g) at 1 bar is relatively easily calculated: • H2O (l) ------> ½ O2 (g, 1 bar) + 2 H+ (aq) + 2 e- • Note for consistency in constructing the diagram this decomposition must be written as a reduction: • ½ O2 (g, 1 bar) + 2 H+ (aq) + 2 e- ------> 1 H2O (l) • e = - DGo / (n F) - ( 0.05911 V / n ) log [ a2H2O (l) / a O2 (g) a2H+ (aq) ] • = - DGo / (2 F) - ( 0.05911 V / 2 ) log a-2H+ (aq) • = - DGo / (2 F) - ( 0.05911 V ) pH • Calculating DGo in this case gives: • DGo = + 1 DGo m,f, H2O(l) = + 1 ( - 237.2 kJ ) • = - 237.2 kJ gives: • e = - DGo / (2 F) - ( 0.05917 V ) pH = - (- 237.2 10+3 J / (2 (( 96,486.8 C )) - ( 0.05911 V ) pH = + 1.23 V - ( 0.05911 V ) pH
This equation can be plotted on an Eh-pH diagram to give the other stablility boundary for water: Above this line water is unstable with respect to oxidative decomposition to O2 (g) at 1 bar of pressure.
The regions within the stability field for water where Fe3+ and Fe2+ are stable can be determined by considering the reduction of iron (III) to iron (II): • Fe3+ (aq) ------> Fe2+ (aq) + e – • DGo = DGom,f, Fe2+- DGo m,f, Fe3+ • = ( - 78.87 kJ ) - ( - 4.6 kJ ) • = - 74.27 kJ • e = - DGo / (n F) - ( 0.05911 V / n ) log [ a Fe2+/ a Fe3+ ] • = - ( -74.27 10+3 J / (1 (( 96,570 C )) • - ( 0.05911 V / 1 ) log [ a Fe2+/ a Fe3+ ] • = + 0.769 V - ( 0.05911 V ) log [ a Fe2+/ a Fe3+ ] • To further develop this equation requires making a choice about the activities of Fe3+ and Fe2+. The usual choice is to take the activities of dissolved species as 10-6, although other choices can be made. • e = + 0.769 V - ( 0.05911 V ) log [10-6/ 10-6 ] • = + 0.769 V Notice that e is independent of pH, because the reduction we were considering did not involve, H+ (aq) or OH- (aq) and will plot as a straight line parallel to the pH axis on the Eh-pH diagram.
Note that the more oxidized species, in this case Fe3+, is stable at the higher Eh.
Now consider the relative stability of Fe3+ (aq) and FeO(OH) (s), the mineral goethite: • FeO(OH) (s) + 3 H+ (aq) ------> Fe3+ (aq) + 2 H2O (l) • Note that in this equilibrium no species is being oxidized or reduced. • DGo = DGom,f, Fe3++ 2 DGom,f, H2O (l) - DGo m,f, FeO(OH) (s) • = ( - 4.6 kJ ) + 2 ( - 237.2 kJ ) - ( - 488.57 kJ ) • = + 9.6 kJ • Why was DGom,f, H+ not included in this calculation? • (n = 0 ) e = - DGo / F - ( 0.05911 V ) log [ a Fe3+/ a FeO(OH) (s) ] • - ( 0.05911 V ) 3 pH • 0 = - ( + 9.6 10+3 J ) / ( 96,570 C ) • - ( 0.05911 V ) log [ 10-6/ 1 ] • - ( 0.05911 V ) 3 pH • = ( - 9.94 10-5 V ) - 6 (- 0.05911 V ) - ( 0.1773 V ) pH • = + 0.255 V - ( 0.1773 V ) pH • pH = 1.44 • Notice that when the equilibrium did not involve and oxidation or reduction, pH is independent of e and will plot as a straight line parallel to the e axis on the Eh-pH diagram.
Now consider the relative stability of Fe2+ (aq) and FeO(OH) (s): • FeO(OH) (s) + 3 H+ (aq) + e- ------> Fe2+ (aq) + 2 H2O (l) • DGo = DGom,f, Fe2++ 2 DGom,f, H2O (l) - DGo m,f, FeO(OH) (s) • = ( - 78.87 kJ ) + 2 ( - 237.2 kJ ) - ( - 488.57 kJ ) • = - 64.7 kJ • e = - DGo / (n F) - ( 0.05911 V / n ) log [ a Fe2+ ] • - ( 0.05911 V ) 3 pH • = - ( - 64.7 10+3 J / (1 (( 96,570 C )) • - ( 0.05911 V / 1 ) log [ 10-6 ] • - ( 0.05911 V ) 3 pH • = + 0.670 V + 0.355 V - ( 0.1773 V ) pH • = + 1.025 V - ( 0.1773 V ) pH
Any oxidation or reduction equilibrium that involves H+ (aq) or OH- (aq) will plot as a sloped line on these Eh-pH diagrams.
Now consider the relative stability of FeO(OH) (s) and Fe3O4 (s), magnetite: • 3 FeO(OH) (s) + H+ (aq) + e- ------> Fe3O4 (s) + 2 H2O (l) • DGo = DGo m,f, Fe3O4 (s) + 2 DGo m,f, H3O (l) - 3 DGo m,f, FeO(OH) (s) • = ( - 1015 kJ ) + 2 ( - 237.2 kJ ) - 3 ( - 488.57 kJ ) • = - 24.13 kJ • e = - DGo / (n F) - ( 0.05911 V ) 1 pH • = - ( - 24.13 10+3 J / (1 (( 96,570 C )) • - ( 0.05911 V ) 1 pH • = + 0.250 V - ( 0.05911 V ) pH
Now consider the relative stability of Fe2+ (aq) and Fe3O4 (s), magnetite: • Fe3O4 (s) + 8 H+ (aq) + 2 e- ------> 3 Fe2+ (aq) + 4 H2O (l) • DGo = 3 DGom,f, Fe2++ 4 DGom,f, H2O (l) - DGo m,f, Fe3O4 (s) • = 3 ( - 78.87 kJ ) + 4 ( - 237.2 kJ ) - ( - 1015 kJ ) • = - 170 kJ • e = - DGo / (n F) - ( 0.05911 V / n ) log [ a3Fe2+ ] • - (( 0.05911 V ) 8 / 2 ) pH • = - ( - 170 10+3 J / (2 ( 96,570 C ))) • - 3 ( 0.05911 V / 2 ) log [ 10-6 ] • - (( 0.05911 V ) 8 / 2 ) pH • = + 0.880 V + 0.532 V - ( 0.1773 V ) pH • = + 1.025 V - ( 0.2364 V ) pH
Note that Fe2+ (aq) - Fe3O4 (s) line meets the intersection of the FeO(OH) (s) - Fe3O4 (s) and Fe2+ (aq) - FeO(OH) (s) lines, as, of course, it should. These expectations can be used to reduce the effort required to construct these diagrams. Based on the above diagram what iron species and what iron equilibria would you expect to dominate natural waters containing iron?
How does the Eh-pH diagram change if activities of the aquesous ions involved in the various equilibria are changed by a factor of 10 in either direction from the 10-6 values that have been used so far? Using the result for the Fe2+ (aq) and Fe3O4 (s) equilibria previously derived for aFe2+ = 10-6: e = + 0.880 V - 3 ( 0.05911 V / 2 ) log [ 10-6 ] - ( 0.1773 V ) pH equations can be quickly derived for: aFe2+ = 10-5: e = + 0.880 V - 3 ( 0.05911 V / 2 ) log [ 10-5 ] - ( 0.1773 V ) pH = 1.323 V - ( 0.1773 V ) pH and for aFe2+ = 10-7: e = + 0.880 V - 3 ( 0.05911 V / 2 ) log [ 10-7 ] - ( 0.1773 V ) pH = 1.500 V - ( 0.1773 V ) pH The positions of the other lines of equilibria can relatively quickly established based on the intersections of the above lines with lines that don’t shift and the fact the changing these activities does not affect the slope of the lines.
Note that where the aqueous ionic species is in the products of the equilibria used to derive these lines, decreasing that ionic species activity increases it’s stability field.
Where does elemental iron occur in this Eh-pH diagram? • Consider the reduction of Fe2+ (aq) to Fe (s): • Fe2+ (aq) + 2 e – ------> Fe (s) • DGo = DGom,f, Fe (s)- DGo m,f, Fe2+ • = ( 0 kJ ) - ( - 78.87 kJ ) • = + 78.87 kJ • e = - DGo / (n F) - ( 0.05911 V / n ) log [ 1/ a Fe2+ ] • = - ( +78.87 10+3 J / (2 (( 96,570 C )) • - ( 0.05911 V / 2 ) log [ 1/ a Fe2+ ] • = - 0.4084 V - ( 0.05911 V / 2 ) log [ 1/ 10-6 ] • = - 0.4084 V - 0.1773 V • = - 0.5857 V
Also consider the reduction of magnetite to elemental iron: • Fe3O4 (s) + 8 H+ (aq) + 8 e- ------> 3 Fe (s) + 4 H2O (l) • DGo = 4 DGom,f, H2O (l) - DGo m,f, Fe3O4 (s) • = 4 ( - 237.2 kJ ) - ( - 1015 kJ ) • = + 66.2 kJ • e = - DGo / (n F - (( 0.05911 V ) 8 / 8 ) pH • = - ( + 66.2 10+3 J / (8 ( 96,570 C ))) • - ( 0.05911 V ) pH • = - 0.086 V - ( 0.05911 V ) pH
Plotting these lines on the Eh-pH diagram gives: Would you expect to find elemental iron in a wet oxygen rich environment? Under what conditions of Eh and pH is siderite, FeCO3 (s), stable? To answer this question assume that PCO2 (g) is 10-3.47 bar, roughly the global average value for the partial pressure of carbon dioxide.
The iron – oxygen diagram that we have developed is a strong function of the species considered and would look differently, if other species were taken into account, e.g. FeOH2+ (aq), Fe(OH)2+, etc. For example, if hematite, Fe2O3 (s), had been considered, it would occupy the entire stability field now occupied by geothite, FeO(OH) (s) and since hematite is thermodynamically more stable, it would be the species represented on the diagram. Geothite is a precursor to hematite and kinetically it takes several months to convert geothite to hematite and so the diagram developed in these notes would apply to the short time formation of iron precipitates. An Atlas of Eh pH Diagrams, Intercomparison of Thermodynamic Databases, Geological Survey of Japan, Open File Report No. 419, National Institute of Advanced Industrial Science and Technology Research Center for Deep Geological Environments Naoto TAKENO, May 2005 is available on the web at: http://www.gsj.jp/GDB/openfile/files/no0419/openfile419e.pdf Pages 101 to 103 of this reference cover the iron oxygen system. There are a number of commercial software packages that will generate Eh pH diagrams, notably STABCAL: http://www.mtech.edu/hhuang/predominance.htm developed by Hsin-Hsiung Huang of the Metallurgical Engineering Department at Montana Tech. These comments just point out that these diagrams should be used with caution.


![There is a formula to find pH pH = -log [H + ] or pH = -log [ H 3 O + ]](https://cdn2.slideserve.com/4664265/slide1-dt.jpg)