
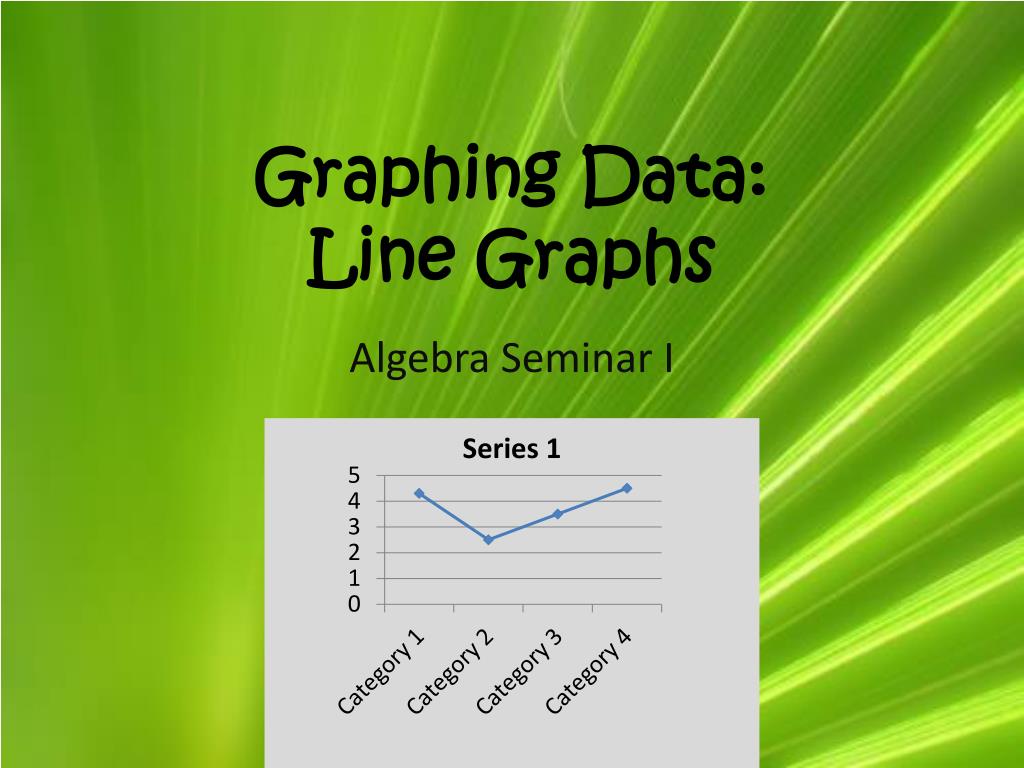
Graphing Data: Line Graphs

This seminar explores the fundamentals of line graphs, a graphical tool utilized to exhibit changes in data over specified periods. We will examine how to connect data points through line segments to visualize trends effectively. Line graphs are particularly useful for tracking both short and long-term changes and comparing multiple datasets simultaneously. By analyzing examples, including sales data for electronics, participants will gain insights into the practical applications of line graphs. Essential concepts such as the Coordinate Plane and the Line of Best Fit will also be covered.
Télécharger la présentation 
Politique de téléchargement : le contenu du site vous est fourni TEL QUEL pour votre information et votre usage personnel ; il ne peut être vendu, concédé sous licence ni partagé sur d’autres sites sans l’accord de son auteur.Le contenu vous est fourni TEL QUEL, pour votre information et votre usage personnel uniquement. Téléchargez la présentation en cliquant sur ce lien. Lors du téléchargement, si vous ne parvenez pas à télécharger une présentation, l’éditeur a peut-être supprimé le fichier de son serveur.Pendant le téléchargement, si vous ne parvenez pas à obtenir une présentation, le fichier a peut-être été supprimé par l’éditeur.
F I N