Easy Access to R Tutorial for Statistics Beginners
Learn to access R on Windows, Unix, and web-based platforms. Explore basic operations, matrix functions, statistics, control structures, distributions, productivity tips, and external packages. Increase efficiency with functions and enhance skills with practice exercises. Get started with R for statistical analysis.

Easy Access to R Tutorial for Statistics Beginners
E N D
Presentation Transcript
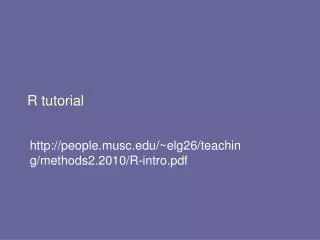
R tutorial Stat 140 Linjuan Qian lqian@fas.harvard.edu
Accessing R • “Windows”: free version of R can be downloaded from http://www.r-project.org; Also every machine in FAS lab and stat lab preinstalled R. Just open “R console”. • “Unix”: login into nice.harvard.edu or stat.harvard.edu, type “R” at the Unix prompt. • “Web-based”: copy and paste http://rweb.stat.umn.edu/Rweb/Rweb.general.html • Using q() to quit from R • Get help: help(mean) or help->Html help
Basic Stuff: • Assignment operators: x<-c(1,2); y=c(3,4); a<-matrix(c(1,2,3,4), nrow=2, ncol=2); z<-cbind(x,y); w<-rbind(x,y); • “matrix based”: everything is done as vectors. try x+y;x*y;x%*%y;x%*%t(y);solve(a) • Arithmetic Operators: +,-,*,/,^ • Comparison Operators: ==, !=, >, <, >=, <= • Logical Operators: &&, || • Comment: #
Input data • From command line: • x <- c(1,2,3,4) • Y = 1:100; Y=seq(1,100,1) • new.vector <- rep(0, n) • z <- matrix(Y, nrow=20, ncol=5) • From data file: • data<-read.table(“dataset.txt”, header=T)
Basic Statistics: • Summmary: summary(vector),mean, var, sd • Tests: t.test(vector), var.test(vector1, vector2) • Sorting: max, min, sort • Graph: hist(vector), boxplot, qqplot, plot • Regression: model<- lm(z~x+y) • Sampling: sample(x, 1000, replace=T, prob=NULL) Ornext slide
Control Structure • Condition: if(a==5){ b=1 } else if(a<=3){ b=2 } else{ b=3 } • Loop: be aware, R is notorious for loops, try to avoid using loops as much as you can! • while (a<3) {a=a+1} • for (i in 1:10){x=x+i} break next
Functions about Distributions • The names for various distributions are as follows: norm : normal; beta : beta chisq : chi squared; pois : Poisson gamma : gamma; binom : binomial nbinom: negative binomial; t : t; f : F unif: uniform; • Then you can add one of four letters to each distribution to create a command: r: random draws d: density functions (pdf or pmf) q: quantiles p: cdf (cumulative probabilities) • Example: rnorm(10, mean=0, sd=1); dnorm(0, mean=0, sd=1)
Enhance your productivity • Save a series of command as a text file and run it as a program. • Within R: source(“infile.txt”) • Writing your own functions: • my.function <- function(arguments) { content return(output) }
Other packages: • Functions are grouped as packages • Install packages: Windows menu: packages -> install.. Unix&Windows:install.packages("MASS") • Load packages before use: library(MASS) help(mvrnorm)
Relevant to HW 1 • Install a package called “gregmisc”, which offers the permutation and combination function. • Input data values and compute basic statistics such as sum and mean • For matrix, compute row/column mean • “Filtering” out important values • Plots and test commands can be easily found