Dahl Winters 10/11/2006
140 likes | 293 Vues
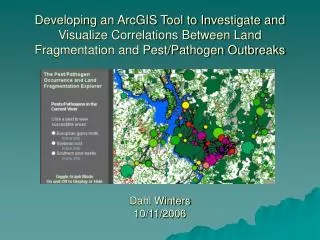
Developing an ArcGIS Tool to Investigate and Visualize Correlations Between Land Fragmentation and Pest/Pathogen Outbreaks. Dahl Winters 10/11/2006. Background. The ecological consequences of land fragmentation are well known.

Dahl Winters 10/11/2006
E N D
Presentation Transcript
Developing an ArcGIS Tool to Investigate and Visualize Correlations Between Land Fragmentation and Pest/Pathogen Outbreaks Dahl Winters10/11/2006
Background • The ecological consequences of land fragmentation are well known. • However, there might also be more direct economic consequences, i.e. impacts on crops or pine plantations, that are not so well known. • Few studies have been done to analyze what consequences land fragmentation might have on the persistence of pests and pathogens. • This is a major issue for people whose livelihoods depend on crops and timber. It also has consequences for environmental health because pesticides are often over-used to prevent against outbreaks, but outbreak risk varies depending on distance to susceptible areas.
Why Is This Important? • Timber harvest revenues, by USDA Forest Service Region of the United States, 1952 to 1997 (Wear, D.N. 2002. [Data]. On file with: Southern Research Station, Forestry Sciences Laboratory, P.O. Box 12254, Research Triangle Park, NC 27709).http://www.srs.fs.usda.gov/sustain/report/timbr1/timbr1-21.htm
Why Is This Important? • Counties in outbreak status for southern pine beetle; a 40-year summary (USDA Forest Service 1999).http://www.srs.fs.usda.gov/sustain/report/hlth2/hlth2-31.htm
Why This Project? • Although the effects of land fragmentation on pest outbreaks is an important issue, most members of the concerned public are unlikely to have the ecology or GIS background needed to answer this question on their own. • The public could benefit from a tool that would allow a user to input their address and learn the relative risk of outbreaks at that location. • Such a tool could help guide simple decision-making, such as which pests and pathogens might be a problem, or what and how much pesticide to apply, if any. • By developing a tool that many people with a wide range of skill sets could use, public awareness of the land fragmentation problem would increase, and the doors would be opened to their further education on its economic and ecological consequences.
Research Problem • How might agricultural and forest pest outbreaks correlate with land fragmentation in North Carolina? The general approach: • Part 1: develop a simple model of land fragmentation and pest susceptibility, for a small number of pest and pathogen types. • This will allow identification of areas where pest occurrence is highly correlated with land fragmentation, and furthermore, places where particular pests are likely to persist. • Part 2:develop a software tool, the Pest/Pathogen Occurrence and Land Fragmentation Explorer, to bring the model results to farmers, forest managers, planning officials, and other interested users.
Data Availability • 1. Land Cover Data: This data will be taken from the 2001 National Land Cover Dataset (NLCD 2001) – free download from the USGS Seamless Data Server. • 2. Crop Distribution Data: The Cropland Data Layer for North Carolina, from the National Agricultural Statistics Service (NASS) • 3. Pest/Pathogen Requirements– This is needed to determine the suitability of habitat patches for each pest/pathogen. Obtained from the National Agricultural Pest Information System (NAPIS). • 4. Pest/Pathogen Occurrence– Occurrence information for 9 pests/pathogens is available from NAPIS.
Pests/pathogens with distribution mapsavailable from NAPIS • Alfalfa weevil Hypera postica • Cereal leaf beetle Oulema melanopus • Corn rootworm, northern Diabrotica barberi • Corn rootworm, western Diabrotica virgifera • European gypsy moth Lymantria dispar • Sweetpotato weevil Cylas formicarius elegantulus Distribution maps available elsewhere: • Southern pine beetle Dendroctonus frontalis • Soybean rust Phakopsora pachyrhiziand P. meibomiae • Soybean cyst nematode Heterodera glycines
Methodology • 1. Determine pest requirements, such as host plant types and cold tolerance, that will affect which land cover classes will support the pest. Use NAPIS data. • 2. Obtain pest occurrence data by county, from NAPIS. • 3. Develop a land fragmentation model using both the NLCD 2001 dataset and the Cropland Data Layer. • 4. Create a visualization tool allowing users to input their address and view what pests/pathogens they are susceptible to, according to the fragmentation-occurrence model. The tool will also use a graph-theoretic approach to allow users to investigate how various land use scenarios might alter pest susceptibility.
Design Flowchart for the Pest/Pathogen Susceptibility Tool User chooses from 3 location input methods Verify location is in NC; convert address or lat/long coordinates to decimal degrees Location is passed to Fragmentation Model User inputs their location 1. Input 2. Model GIS Data Layers General Information Pest/Pathogen Requirements NLCD 2001 Land Cover Dataset Cropland Data Layer: Crop Distribution NAPIS County Pest/Pathogen Occurrence Data The Two Main Functions Under User Control 3. Interface 1. User selects a pest/pathogen to view susceptible patches Display susceptible patches Program zooms in on location; returns pest/pathogen susceptibilities with radio buttons Edit Graph: User can add/remove nodes 2. User can toggle graph on/off to view connectivity If on, enable Edit and Recalc Graph Recalc Graph: Displays new connectivity after user alterations
How to Interpret and Use Results • The greatest usefulness of this tool will be to allow the user to generate and explore what-if scenarios of land use, and the probable outcome of that land use on pest susceptibility. • This tool can also help users manage their pesticide use. • This model is intended to be used only a tool for visualizing the impact that local land uses might have on pest occurrence and persistence. It is not meant to be exact.
Sources of Uncertainty • 1. The National Land Cover Dataset has pixel misclassification errors. Accuracy levels range from 52% to over 90%, with the majority of classes over 75% accurate. • 2. The Cropland Data Layer also has misclassification errors. Accuracy levels are better: 80-90%. • 3. Necessary oversimplification: to make this model simple to understand, variables other than land fragmentation that affect pest distribution must be excluded • This error is considered acceptable because other variables play a minor role: 1) fragmentation is so prevalent in the NC landscape, and 2) at that scale, land cover strongly determines where pest populations and outbreaks can occur. • 4. Exactly how land fragmentation will affect pest occurrence/persistence is unknown. More research will be required to get a better understanding of this.