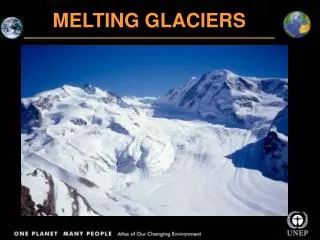
MELTING GLACIERS
E N D
Presentation Transcript
GlobalWarming • According to the recent IPCC report, the mean global surface temperature has increased by 0.74OC over the last 100 years (1906-2005) • 11 of the 12 warmest years have been recorded in the past 12 years
Findings of the IPCC Assessment Report (2007) • There has been a significant decline in the mountain glaciers and snow cover, which has contributed to the increased sea levels • From 1961 to 2003, the global mean sea level rose by 1.8 (+0.5) mm per year • The global temperature of the oceans increased by 0.10oC from surface to depth of 700m from 1961- 2003 and 80% of the heat added to the climate system is being absorbed by the ocean • Other long term climatic changes that have been observed include extreme droughts, intensity of tropical cyclones, changes in the salinity of the ocean and wind patterns
Changes in the precipitation pattern :IPCC Report (2007) • Precipitation has significantly increased (+) in eastern North and South America, northern and central Asia and northern Europe • There has been decline (-) in precipitation in the Mediterranean, some regions in southern Asia, southern Africa and Sahel
Melting of the Greenland Ice Sheet • According to NASA scientists, the Greenland ice sheet is melting faster than it is being replaced, contributing to sea level rise • The loss of ice from Greenland doubled between 1996 and 2005 • From 1996 to 2000, the largest acceleration and mass loss came from southeast Greenland • From 2000 to 2005, the trend extended to include central east and west Greenland • It is estimated that 69 per cent of the ice-mass loss in recent years came from eastern Greenland
Greenland ice is declining faster than expected • Between 2003 and 2005 the low coastal areas of Greenland lost 155 gigatons of ice per year due to excess melting while the high elevation interior gained 54 gigatons annually from excess snowfall • Between 2004 and 2006, the rate of melting accelerated, with the massive ice sheet melting two and one-half times faster than the previous two-year period • Greenland lost roughly 164 cubic miles of ice from April 2004 to April 2006—more than the volume of the North American Great Lake Erie
Greenland Ice Sheet Dramatic ice mass losses concentrated in the low-elevation coastal regions, with nearly half of the loss coming from southeast Greenland NASA Earth Observatory
Greenland Ice Sheet Greenland is now losing 20 percent more mass than it receives from new snowfall each year. NASA Earth Observatory
Greenland Ice Sheet University of Colorado, CIRES
Melting of ice in Greenland 2001-2003: A significant increase in the melting area has been observed along the edge of the ice cap in Greenland. NASA Earth Observatory
Retreat of Ice and Snow in Greenland Ice loses in Greenland range from 5 to 25 centimeters of water equivalent per year NASA Earth Observatory
Melting ice reveals New Islandoff Greenland 11 Aug 1985: Ice covered the northern edge of the island and extended well to the north 5 Sep 2002: This image shows substantial ice retreat, with just a few remnants remaining in the southeast 2 Sep 2005: A strait between the claw-shaped island and mainland Greenland is clearly visible in this image NASA Earth Observatory
Calving of Helheim Glacier, Greenland The glacier’s peak rate of flow has increased from 8 km/yr in 2000 to 11 km/yr in 2005 Helheim glacier, located in southeast Greenland, is now one of the fastest moving glaciers in the world 1986-2006: These images show the retreat of Helheim glacier’s calving front • This May 2005 picture of Helheim Glacier, demonstrates high calving activity associated with faster glacial flow
Dramatic changes in Arctic Sea Ice Imagine an ice-free Arctic
Evidence of extensive snowmelts in West Antarctica • January 2005: Areas of extensive snowmelt (shown in yellow and red) have been discovered by a team of NASA and university scientists in response to warmer temperatures in west Antarctica • The combined area affected is as big as California NASA Jet Propulsion Laboratory
Re-freezing in Antarctica • In this image, more ice are in red, and places where less ice was detected are in yellow. Small patches of yellow and red around the coastline of East Antarctica show that at least some melting took place there, but the most significant amounts of ice formed in West Antarctica. NASA Jet Propulsion Laboratory
Breakup of Larsen ice shelf (Antarctic Peninsula) 220 metres thick Larsen B shelf existed for at least 400 years prior to breakup
Disintegration of the Larsen B Ice Shelf, Antarctic Peninsula The ice shelf disintegrated suddenly in March 2002 due to warm summer temperatures NASA Earth Observatory
Breakup of Antarctica’s Ross Ice Shelf • An iceberg (B-15J) of size of a small United States state cracked off the Antarctica’s Ross Ice Shelf in March 2000 • On February 1, 2007, three new icebergs were formed due to the break up of the original iceberg NASA Earth Observatory
Breaking Off Filchner Ice Shelf Antarctica Filchner Ice Shelf is the largest ice shelf on the planet In 1986 the front edge of Ice Shelf broke off into three enormous icebergs
Calving of Ninnis Glacier Antarctica 22 January 2000: The Ninnis Glacier Tongue soon after the initial calving 5 February 2002: Iceberg split into two sections and started moving away from Ninnis Glacier
Cracks on Drygalski Ice Tongue Antarctica The ice tongue was discovered in 1902 21 February 2005: Drygalski calved an iceberg Image shows cracks formed by time and ocean currents
Shrinking Breidamerkurjökull Glacier Iceland • 1973-2000: Images show glacier has receded and the glacial lake at its tip has enlarged
Ice dam in the Hubbard Glacier,United States North America: Angangueo • 1985 –Hubbard Glacier • 1986: Images show Degradation of forest area • 1986 –Hubbard Glacier blocks Russell Fjord • 2001: Between 1984 and 1999, 38 per cent of forests were degraded • 2002 –Hubbard Glacier blocks Russell Fjord again • 2003 – Glacier has retreated
Hubbard Glacier advances United States North America: Angangueo • 1986: Images show Degradation of forest area • 2001: Between 1984 and 1999, 38 per cent of forests were degraded 10 Aug 2002 14 Aug 2002
North America: Angangueo Glacier National Park, Montana, United States • Only 37 glaciers exist compared to 147 glaciers, 150 years ago • The glaciers are one-third their size in 1850 • Scientist predict that all the glaciers will disappear by 2030 • 1986: Images show Degradation of forest area • 2001: Between 1984 and 1999, 38 per cent of forests were degraded 10 Aug 1972-14 July 1974 7 July 2001 NASA Earth Observatory
North America: Angangueo Glacier National Park, Montana, United States • 1986: Images show Degradation of forest area • 2001: Between 1984 and 1999, 38 per cent of forests were degraded
North America: Angangueo Glacier National Park, Montana, United States • 1986: Images show Degradation of forest area • 2001: Between 1984 and 1999, 38 per cent of forests were degraded
North America: Angangueo Retreat of Columbia Glacier, Alaska and Arapaho Glacier, Colorado, United States • Since 1980, the Columbia glacier has retreated about 15 kilometers but its retreat has not been directly linked to rise in global temperatures • Arapaho glacier has thinned by 40 meters since 1960 • 1986: Images show Degradation of forest area • 2001: Between 1984 and 1999, 38 per cent of forests were degraded NASA Earth Observatory
North America: Angangueo Athabasca Glacier, Canada • Athabasca glacier has receded more than 1.5 kilometres in last 125 years • It has lost half of its volume • 1986: Images show Degradation of forest area • 2001: Between 1984 and 1999, 38 per cent of forests were degraded NASA Earth Observatory • About 8000 cubic kilometres of ice have been lost by glaciers worldwide since 1960.
North America: Angangueo Ayles Ice Shelf, Ellesmere Island, Canada Ayles Ice Shelf on Ellesmere Island, broke free on August 13, 2005 and drifted out to the sea • 1986: Images show Degradation of forest area • 2001: Between 1984 and 1999, 38 per cent of forests were degraded NASA Earth Observatory
Shrinking Lake Chad shared by Nigeria, Niger, Chad and Cameroon Persistent drought has shrunk the lake to about a tenth of its former size • 1972: Larger lake surface area is visible in this image • 2001: Due to regionally drying climate and human demand for fresh water, Lake Chad is fraction of what is once was • 2004: In many places, the green of wetlands is being replaced by drifting sand dunes (tan ripples mixed with green)
Declining Rwenzori Mountain Glaciers in East Africa This decline is attributed to increased air temperature and decreased accumulation and convective cloud activity 1987-2002: Images show a gradual decrease of the glacial area, especially on the peaks
Disappearing Icecap of Mt. Kilimanjaro, Tanzania Africa’s highest mountain with a forest belt having rich diversity of ecosystems • 1976: Glaciers covered most of the summit • 2000: The glaciers had receded alarmingly
Retreat of Gangotri Glacier, India • Gangotri glacier has retreated more than 850 metres, in the last 25 years • It has retreated more than 76 metres from 1996 to 1999 NASA Earth Observatory
Glacial Lakes and Glacial Lake Outburst Floods Glacial Lakes in the Bhutan-Himalaya Region • Glacial lakes are formed due to the melting of ice and snow from glaciers • Due to the faster rate of melting from the glaciers, possibly due to global warming, water is accumulating at an increasing rate in these lakes • Sudden outburst results in Glacial Lake Outburst Flood (GLOF) downstream causing destruction of life and property Jeffrey Kargel, USGS/NASA JPL/AGU
Retreat of Upsala Glacier, Argentina The Upsala glacier has retreated more than 4 kilometres since late 1960’s to mid 1990’s and continues to retreat January 2004 position NASA Earth Observatory
Retreat of San Quintin Glacier, Chile The San Quintin Glacier appears to be losing mass and retreating NASA Earth Observatory
MELTING GLACIERS UNEP Atlas of Our Changing Environment Thank You! Free Download: www.na.unep.net