Download

1 / 21
220 likes | 513 Vues
AJ Clair, Tommy Durand, & Jeremy Polster. A probability Model for Golf Putting. Golf Background. Golf is hard! Some view putting as the most difficult part of golf A study examining professional golfers showed that they were successful on less than 60% of their five-foot putts. Putting Data.

E N D
AJ Clair, Tommy Durand, & Jeremy Polster A probability Model for Golf Putting
Golf Background • Golf is hard! • Some view putting as the most difficult part of golf • A study examining professional golfers showed that they were successful on less than 60% of their five-foot putts.
Putting Data • Berry, D. Statistics: A Bayesian Perspective.Belmont, CA. 1995: Duxbury Press • Distance (ft)TriedSuccess% Made • 2 1443 1346 93.2800 • 3 694 577 83.1400 • 4 455 337 74.0700 • 5 353 208 58.9200 • 6 272 149 54.7800 • 7 256 136 53.1200 • 8 240 111 46.2500 • 9 217 69 31.8000 • 10 200 67 33.5000 • 11 237 75 31.6500 • 12 202 52 25.7400 • 13 192 46 23.9600 • 14 174 54 31.0300 • 15 167 28 16.7700 • 16 201 27 13.4300 • 17 195 31 15.9000 • 18 191 33 17.2800 • 19 147 20 13.6100 • 20 152 24 15.7900
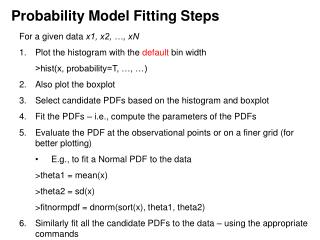
Looking at an Appropriate Putting Model • We can view this as a trigonometric model • When Ө is less than the “threshold angle” the ball will go in the hole. • Threshold angle = arcsin[(R-r)/x]
Can the Model Be Used to Estimate Probability of Successful Putts? • We can imagine a normal distribution to represent the random variable, Ө
Probability Model • Using this normal distribution, the probability of a successful putt is: • Φ represents the standard normal distribution function and σ is the standard deviation • The hole diameter, 2R = 4.25 inches and the ball diameter, 2r = 1.68 inches
Using several mathematical properties including the small angle approximation for the arcsin, we can simplify the equation to: • Using this approximation we calculate the probabilities of a putt at all the given distances. We do this using the estimated value for σ = 0.026 (1.5 degrees)
Problems with Linear and Quadratic Models • Linear • 2 to 3 ft change is not the same as 19 to 20 ft change • Probability model will show probabilities not bound between 0 and 1 • Quadratic • Might have larger R-sq yet an increasing probability at higher distance is not likely • Also, can show probabilities not bound between 0 and 1
Alternative Probability Model • One common estimator for probability models is a d-probit estimator • This is a logistic function which is bound between 0 and 1
Our Experiment • Using the actual probabilities for putting given by Berry, we simulated 100 putts for each distance using binomial random data • We then ran a d-probit regression on the data
Our Results • The coefficient for distance in our d-probit regression was -.026567 • This is interpreted as a one foot increase in distance results in a 2.66% decrease in the probability of success for a putt • The 95% confidence interval for the coefficient was (-.031888, -.021246)
Discussion • Note both linear regressions for the actual probabilities and the equation estimated probabilities have slopes included in the confidence interval for our experiment’s coefficient • These slopes are interpreted the same way as the coefficient
Problems With Model • The model only accounts for the angle at which the ball is hit • Does not account for putts that are too short and balls which partly cover the hole and go in • Also it only accounts for distance not terrain, playing conditions, or golfer ability
Conclusion • We can conclude that for our data range, our linear probability models are quite accurate at predicting the change in probability from the change in distance. • Also, the equation for estimating the probabilities appears to be a good estimate for the actual probabilities • However with a larger range of data the linear probability model may not be suitable
References • Berry, D. Statistics: A Bayesian Perspective. Belmont, CA. 1995: Duxbury Press • http://godplaysdice.blogspot.com/2008/06/probability-of-making-putt.html • Gelman, A., Nolan D. “A Probability Model for Golf Putting.” Teaching Statistics Vol. 24 No. 3 pg. 93-95