Economics 350
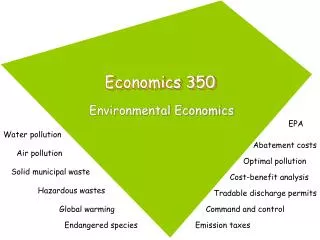
Economics 350 EPA Water pollution Optimal pollution Environmental Economics Air pollution Abatement costs Solid municipal waste Cost-benefit analysis Hazardous wastes Tradable discharge permits Global warming Command and control Endangered species Emission taxes Organic wastes

Economics 350
E N D
Presentation Transcript
Economics 350 EPA Water pollution Optimal pollution Environmental Economics Air pollution Abatement costs Solid municipal waste Cost-benefit analysis Hazardous wastes Tradable discharge permits Global warming Command and control Endangered species Emission taxes
Organic wastes Sewage, residuals from factories, pesticides, oil, detergent Inorganic substances Toxic metals, salts, acids, nitrates Non-material Radioactivity, heat Infectious agents Bacteria, viruses Point source vs. Non-point source Continuous vs episodic Persistent vs degradable Types of Water Pollutants
DO (ppm) “sag” Time or Distance t Biochemical Oxygen Demand (BOD) • High levels of DO (dissolved oxygen) are good • DO used up in degradation process • BOD: amount of oxygen required to decompose organic material
Initial burden was on states/localities EPA established in 1970 Federally set TBES State/local enforcement Municipal treatment subsidies Refuse Act (1899) Water Pollution Control Act (1948, 1956, 1972) Introduced TBES in 1972; moved away from AQ standards Loan subsidies for construction of water treatment facilities Zero discharge goal by 1985 Clean Water Act (1977) Fishable-swimmable goal Focus on toxic effluents Water Quality Act (1965, 1987) Converted water treatment subsidies to revolving loan fund Focus on non-point sources Water Pollution Policy
Technology-Based Effluent Standards • Effluent standard set at the level of emissions a source would produce if it used particular technologies • Best Practicable Technology (BPT) by 1977 • Best Available Technology (BAT) by 1983 • Best Conventional Technology (BCT) after 1984
Estimated Total Costs and Emissions from Sugar-Beet Plants Using Alternative Abatement Technology BPT = ? BAT = ? BCT = ?
Efficiency and Cost Effectiveness of TBES • Efficiency conditions not met • Equimarginal principle not satisfied • Marginal damages not considered • Two Questions: • How much has the nation’s water quality been improved as a result of the system? • How much more improvement could have been obtained with a more cost-effective approach? 600 subcategories of water-polluting industries
Rivers and Streams Supporting Recreational Uses: With and Without CWA 632,552 Miles Analyzed during the mid-1990s If all point-source emissions are eliminated
Comparison of Point Source Water Pollution-Control Costs: TBES vs Least-Cost
TBESs and Incentives • Weak incentives to adopt cleaner technology • Creates bias toward “end-of-the-pipe” techniques • Ignores input reduction • Ignores output reduction • Ignores recycling technology
Enforcement • Discharge permits • Initial compliance vs continued compliance
Municipal Wastewater Treatment Subsidies • Federal subsidies to build plants • Degree of Treatment • Primary: use physical steps (removes 35-40% BOD) • Secondary: use biological means (removes another 45-55% BOD) • Tertiary: use chemical process (removes most the rest) • WPCA (1972) mandated at least secondary by 1983
Municipal Wastewater Treatment Subsidies • How are grants allocated? • Needs survey: existing population, problem areas • Political pork • Incentives? • Excess capacity: construction grants but no operating costs grants • Economic development? • No incentive to seek out more efficient tech for cities • Water Quality Act (1987) • Replaced direct grants with State Revolving Fund program (“loans”)
Water Policy Innovations • Focus on Non-point sources • Design standards • No agricultural cultivation on steep slopes • Designs on urban storm sewers • Home builders must control run-off • Tax materials/activities leading to NPS • Fertilizers, chemicals • Total Maximum Daily Load program • Emission limits if TBES don’t achieve ambient standards • Tradable Discharge Permits • Fox River, Chesapeake Bay, Long Island Sound, Dillon Reservoir • Problems • Thin markets • Trading ratios EPA estimates 50%+ of water violations due to NPS
Ozone: filters out ultraviolet radiation Other gases provide for “greenhouse” effect 78% Nitrogen 21% Oxygen
Federal Air Pollution Control Laws • Early law was local in nature; focus on “nuisance laws” • Air Quality Act (1967) • Required states to established ambient standards for “criteria pollutants” • expanded grants to states for air pollution control plans • Clean Air Act (1963, 1966, 1970, 1977, 1990) • Established uniform NAAQS • Established TBES • Stationary vs mobile sources • SO2 tradable discharge permits
Criteria Pollutants • Particulate Matter • Health: breathing symptoms; aggravation of existing respiratory and cardiovascular disease; impairment of the body’s immune systems; damage to lung tissue; premature mortality • Welfare: damage to materials, soiling; visibility impairment • Sulfur Dioxide • Health: adverse effects on breathing; respiratory illness; alterations to lung’s defenses, aggravation of existing respiratory and cardiovascular disease • Welfare: foliar damage on trees and crops; contribution to acid rain; accelerated corrosion of buildings • Carbon Monoxide • Health: exposure to elevated levels causes impairment of visual perception, work capacity, manual dexterity, learning ability and performance of complex tasks; individuals with existing cardiovascular disease are at greater risk • Nitrogen Dioxide • Health: lung irritation, reduced resistance to respiratory infection; continued or frequent exposure may cause higher incidence of acute respiratory disease in children • Welfare: contributes to ozone formation and acid rain • Ozone • Health: reduced lung functioning; damage to lung tissue, increased sensitivity of the lung to other irritants • Welfare: reduction in crop yields; foliar damage to crops and trees, damage to ecosystem • Lead • Health: damage to kidneys, liver, nervous system, and blood forming organs; changes in fundamental enzymatic, energy transfer, and homeostatic mechanisms in the body; excessive exposure can cause neurological problems such as seizures, mental retardation, and/or behavioral problems
National Primary and Secondary Ambient Air-Quality Standards (NAAQS), 2005 Source: Table 15.4, Field and Field (4e), p308
Stationary Source Control • State Implementation Plans (SIPs) • AQCR: 247 regions • Growth management regulations and TBES • TBES • Non-Attainment Areas • Existing Sources: RACT (Reasonably Available Control Technology) • New Sources: LAER (Lowest Achievable Emission Rate) • Prevention of Significant Deterioration (PSD) Areas • Existing Sources: None • New Sources: BACT (Best Available Control Technology) Note: New Source Bias • Creates incentives to hold onto older, dirtier, factories • Creates incentives for older factories to produce to capacity whereas newer factories may have excess capacity Cost-Effectiveness of TBES ?
Comparison of CAC Control Cost with Least Cost Programs Source: Table 15.6, Field and Field (4e), p311
Cap-and-Trade (CAP) Program • 1990 CAA: reduce SO2 emissions by 40% from 1990 levels • Phase I: 1995 – 2000 • 110 power plants in 21 eastern/midwestern states • # permits = (Avg Btu of fuel used) x (2.5 lbs SO2/million Btus) • Phase II: 2000 – present • Covers all power plants in US (approx. 1000) • # permits = (Avg Btu of fuel used) x (1.2 lbs SO2/million Btus) • Overall cap of 8.95 million permits • Trading Rules • CBOT • Participants: corporations, individuals, green groups, speculators • EPA tracks all trades, monitors emissions • $2581 fine for excess SO2
Clean Air Markets in Action • Affected Sources • Allowance Prices • Spot Auction • 7-year Advance Auction • Trends in SO2 Emissions • Geographic mean centers of trading
Mobile Source Emissions • Federal focus has been on emissions per mile • Equimarginal principle suggests all RHS factors should be balanced • New Car Emission Standards • VOC, NOx, CO, PM • “Technology forcing” • Inspection and Maintenance programs • Technology Standards • Reformulated fuels • Alternative fuels: methanol, natural gas, hydrogen • Clean cars: electric vehicles, hybrids Number of Vehicles Average Miles Traveled Emissions per Mile Total Emissions x x = Massachusetts v US EPA: Supreme Court rules 5-4 that CO2 is a pollutant and the EPA is responsible for its regulation
Stationary and Mobile Sources of Criteria Pollutants in the US Source: Table 15.1, Field and Field (4e), p302
Estimated Impacts of 1990 Clean Air Act Source: Table 15.2, Field and Field (4e), p302
Blasts from the past… • Silent Spring (1962) • Rachel Carson’s call to action • DDT banned in 1972 • Possible cause behind thinning eggshells in certain birds • Malaria prevention • Malathion is 2x expensive and must be sprayed 2x as often • Love Canal (1978) • 1920-1940: city used property as dump site (including US Army) • 1942-1953: Hooker Chemical • 1953-1978: Board of Education & Housing • 800 families relocated/reimbursed for homes • Times Beach (1982) • Dioxin used for dust control • 2800 people were bought out • Bhopal (1984) • Union Carbide accident (methyl isocyanate) • 3,800 to 15,000 dead • Chernobyl (1986) • Radiation leak • 50+ dead; 336,000 relocated
Types • Chemicals • Heavy metals • Radioactive materials Note: Monitoring and Control Problems • Chemicals are everywhere • Level of danger • Used in relatively small amounts • Long time gap between exposure and impact
Examples of Federal Laws • Federal Insecticide, Fungicide, and Rodenticide Act (FIFRA; 1972) • Chemical registration • Controls on where and how chemicals are used • Enforcement through inspections, fines, product recalls • Food, Drug, and Cosmetic Act (FDCA; 1938) • Legal prohibition of products that fail to meet certain criteria • Adulterated • Mislabeled • Occupational Safety and Health Act (OSHA; 1970) • Regulated workplace safety
Chemicals in Production and Consumer Products • Delaney Clause: banned all food additives that were shown to cause cancer in lab animals • 1996 law changed standard to “reasonable certainty that no harm will result” • “Balancing” approach • Compare control costs versus damages Marginal Control Cost MD Exposure Level r1
Uniform Standards • Uniform standards at r2 would be inefficient for workplace 1 • Non-uniform standards would result in different MD at each workplace • Firm 1 would have to pay higher wages • Competition would encourage firms to reduce their risks (and thereby lower their wage rates) MD MC1 w1 MC2 w2 r2 r1 Risks of workplace exposure
Policies Approaches for Toxic Emissions and Hazardous Wastes • Federal focus on TBES • “MACT” • Waste Reduction • Recycling residuals • Shifting input usages (non-toxic inputs) • Changing product design • Other approaches • Liability and compensation laws • Insurance market • Taxes • Deposit refunds • Right-to-know laws (TRI & public pressure)
Examples of Federal Laws, cont’d • Resource Conservation and Recovery Act (RCRA; 1976) • Manifest system • Standards for treatment, storage, disposal • Permit system for landfills/incinerators • Comprehensive Environmental Response, Compensation, and Liability Act (CERCLA; 1980) • National Priority List • Superfund: financed by payments from responsible parties • Joint and several liability 1432 Superfund sites (882 have been removed) Hamilton and Viscusi (1999) $100m per cancer case averted
State & Local Issues Municipal Wastes Land Use Control
Environmental Federalism • “States as laboratories” • Fed policy may pre-empt state actions • State regulations must be at least as strict as Fed regulations • State policy can not discriminate against interstate trade • Centralized or decentralized approach? • Depends on extent of emissions mixing • Race to the Bottom?
Disposal Options Landfills Incineration Recycling NIMBY Municipal Solid Waste Media switching?
Municipal Solid Waste Source: Municipal Solid Wastes in the US: 2005 Facts and Figures. Available at http://www.epa.gov/msw/pubs/mswchar05.pdf
Municipal Solid Waste Source: Municipal Solid Wastes in the US: 2005 Facts and Figures. Available at http://www.epa.gov/msw/pubs/mswchar05.pdf
Disposal Options Landfills Incineration Recycling NIMBY Technical Options for Reducing MSW TM = VM + RM VM = TM – RM = TM(1-r) Reduce TM Reduce economic activity Reduce materials intensity Increase Recycling Municipal Solid Waste Media switching? TM = total materials used VM = virgin materials used RM = recycled materials used r = RM/TM “rate of reuse”
Economics of Recycling • Producer and Consumer Decisions • Private costs versus social costs
Producer Decisions $ S1 Increase reuse ratio? • Raise q1, hold q0 S2 Public curbside collection • Reduce q0, hold q1 PV + t Reduce overall demand PV • do both! Increase PV thru tax D q1 q2 q0 Materials With S1: q1 units will be recycled; reuse ratio = q1/q0 Minimum content standards? Taxes or TDP? Cost Effectiveness?
Consumer Decisions • Which goods to buy? In what quantities? • Should I recycle? • Worksheet on Landfill vs Recycling • Mandatory recycling • Disposal taxes • Deposit Refund
40 60 30 50 20 10 30 20 20 30
Development vs Preservation Wetlands Coastal lands Critical habitats Scenic lands Transportation patterns Housing Airports Manufacturing Liquor stores Public Action Land purchases by environmental group Zoning Develop with restrictions 14th Amendment “Takings Clause” May not take private property for a public use without just compensation Land-Use Control Policies
Global Environmental Issues Ozone Depletion Global Warming Biodiversity
Ozone Depletion • Physical Problem • surface ozone produced when hydrocarbons and nitrogen oxides mix under sunlight • stratospheric ozone: 7-10 miles above earth; maintains earth's radiation balance • late 1970s evidence started coming in about depletion; 1985 hole over Antarctica • Causes? • CFCs: refrigerants, propellants, polystyrene • halons: fire suppressants • Damages? • increase in ultraviolet radiation • health impacts: skin cancer, eye disease • agricultural losses: damaged crops
Ozone Policy • CFC ban on aerosols by US in 1978 • Montreal Protocol (1987) • phaseout CFCs by 2000 • multilateral fund to help developing countries • trade restrictions • Success? • Chlorine levels declining • Bromine levels increasing • Ozone hole fluctuating