Understanding Path Loss and Shadowing in Cellular Networks: A Comprehensive Guide
70 likes | 199 Vues
This guide explores the concepts of path loss and shadowing in cellular networks. We cover crucial topics such as log-normal shadowing, combined path loss, and cell coverage area. Emphasis is placed on modeling techniques, including empirical models and ray tracing. We discuss the impact of obstructions and random variations on signal attenuation. The relationship between coverage area and outage probability is also examined, showcasing the trade-offs between coverage and interference. Finally, we detail how model parameters are derived from empirical measurements, ensuring accurate representation of network performance.

Understanding Path Loss and Shadowing in Cellular Networks: A Comprehensive Guide
E N D
Presentation Transcript
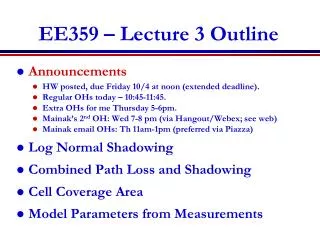
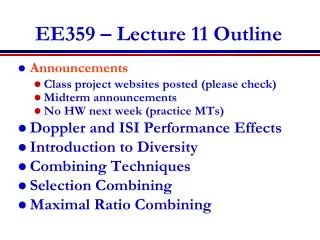
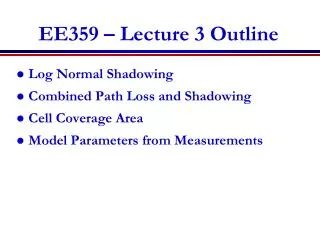
EE359 – Lecture 3 Outline • Log Normal Shadowing • Combined Path Loss and Shadowing • Cell Coverage Area • Model Parameters from Measurements
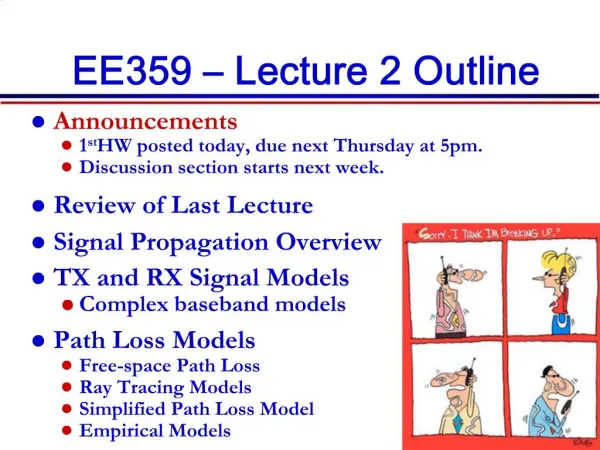
Lecture 2 Review • Ray Tracing Models • Free Space Model • Power falloff with distance proportional to d-2 • Two Ray Model • Power falloff with distance proportional to d-4 • General Ray Tracing • Used for site-specific models • Empirical Models • Simplified Model: Pr=PtK[d0/d]g, 2g8. • Captures main characteristics of path loss
Shadowing • Models attenuation from obstructions • Random due to random # and type of obstructions • Typically follows a log-normal distribution • dB value of power is normally distributed • m=0 (mean captured in path loss), 4<s<12 (empirical) • LLN used to explain this model • Decorrelated over decorrelation distance Xc Xc
Slow Combined Path Loss and Shadowing • Linear Model: y lognormal • dB Model 10logK Pr/Pt (dB) Very slow -10g log d
Outage Probabilityand Cell Coverage Area • Path loss: circular cells • Path loss+shadowing: amoeba cells • Tradeoff between coverage and interference • Outage probability • Probability received power below given minimum • Cell coverage area • % of cell locations at desired power • Increases as shadowing variance decreases • Large % indicates interference to other cells
K (dB) 2 sy 10g log(d0) Model Parameters fromEmpirical Measurements • Fit model to data • Path loss (K,g), d0 known: • “Best fit” line through dB data • K obtained from measurements at d0. • Exponent is MMSE estimate based on data • Captures mean due to shadowing • Shadowing variance • Variance of data relative to path loss model (straight line) with MMSE estimate for g Pr(dB) log(d)
Main Points • Random attenuation due to shadowing modeled as log-normal (empirical parameters) • Shadowing decorrelates over decorrelation distance • Combined path loss and shadowing leads to outage and amoeba-like cell shapes • Cellular coverage area dictates the percentage of locations within a cell that are not in outage • Path loss and shadowing parameters are obtained from empirical measurements