Download
1 / 32
360 likes | 636 Vues
Accuracy Assessment of Thematic Maps. Thematic Accuracy. Learning Objectives. What is accuracy assessment and why is it crucially important? What is the typical procedure for assessing thematic accuracy of maps? What are reference data, and how are they collected?

E N D
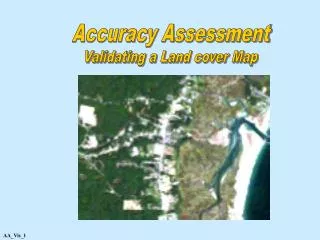
Accuracy Assessment of Thematic Maps Thematic Accuracy
Learning Objectives • What is accuracy assessment and why is it crucially important? • What is the typical procedure for assessing thematic accuracy of maps? • What are reference data, and how are they collected? • What is contingency table analysis, and how do you calculate the common accuracy metrics? • As a map maker, what can you learn from accuracy assessment?
What is Accuracy Assessment? Map Accuracy -- The proportion of agreement between a classified map and reference data assumed to be correct. Thematic Precision – The level of detail that is mapped. A map distinguishing lodgepole pine, Douglas fir, Ponderosa, etc. is more precise (but probably less accurate!) than a map just showing Forest. Accuracy and precision are DIFFERENT!
Spatial Accuracy vs. Thematic Accuracy • Thematic accuracy is how well the class names on the map correspond to what is really on the ground. • Spatial accuracy quantifies errors in the locations of boundaries. • Thematic and spatial accuracy are related but are usually treated separately.
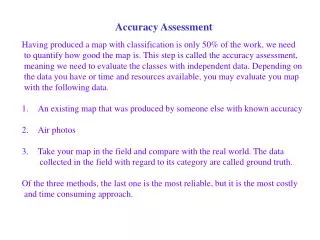
Steps for performing thematic accuracy assessment: • Develop a sampling scheme • Collect reference data • Compare reference data to classified map • Compute accuracy metrics and deliver to map users
Sampling Schemes • Reference locations must be unbiased • Reference locations must be large enough to find with certainty on your classified image • You must ensure that you can correctly identify the types at your reference sites • You must visit LOTS of reference locations
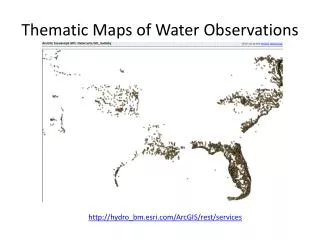
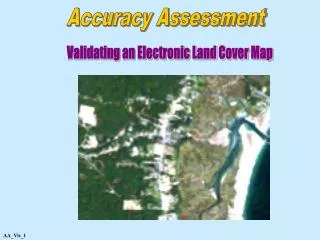
Reference data collection sites for 2001 NLCD map, with ecoregions.
Collecting Reference Data • Field collection • Use GPS to find pre-determined reference sites • Use explicit definitions of the classes to insure that reference data are consistent (should have done this with map classes too) • Develop efficient plan for visiting sites and contingencies for unreachable sites
Collecting Reference Data (cont.) • Double Sampling – Using high resolution remotely sensed data to assess the accuracy of low resolution data • Air photos, Air videography, higher resolution satellites, etc. • Requires some ground work to “train” yourself to accurately interpret the reference data • May negate the assumption of accurate reference data! • Relatively inexpensive, good for inaccessible areas, fast, etc.
Quantifying Accuracy – Comparing Mapped Types to Reference Types • Contingency Tables = Error Matrices = Confusion Matrices • Traditional Accuracy Statistics are calculated from the error matrix
Contingency Table or Error Matrix • Error matrix consists of n x n array where n is the number of classes • Rows: reference (“correct”) data (n rows) • Columns: mapped classes (n cols)
Error Analyses - Example • Create a map with 3 thematic classes (water, forest and urban) • Collect 95 ground reference data • (Water 33, Forest 39 and Urban 23) • Compare those locations to those places in the map • Generate Error Matrix.
Classification Accuracy • Lots of ways to look at the thematic accuracy of a classification • Overall accuracy • Errors of omission • Errors of commission • User’s accuracy • Producer’s accuracy • Accuracy statistics (e.g., Kappa) • Fuzzy accuracy
Overall Accuracy • Of all of the reference sites, what proportion were mapped correctly? • Easiest to understand but least amount of information for map users and map producers (us).
Overall Accuracy Correctly classified: 21 + 31 + 22 = 74 Total number reference sites = 95 Overall accuracy = 74 / 95 = 77.9%
Off-diagonal Elements • The off-diagonal elements of a contingency table tell us the most about how to improve our remote sensing classification! • Should spend lots of time examining ERRORS to figure out what went wrong
Errors of Omission • The type on the ground is not that type on the classified image – the real type is OMITTED from the classified image.
Omission Error For water: 5 + 7 = 12 12 / 33 = 36% For forest: 6 + 2 = 8 8 / 39 = 20% For urban: 0 + 1 = 1 1 / 23 = 4%
Errors of Commission • A type on the classified image is not that type on the ground – the type is COMMITTED to the classified image.
Commission Error For water: 6 + 0 = 6 6 / 27 = 22% For forest: 5 + 1 = 6 6 / 37 = 16% For urban: 7 + 2 = 9 9 / 31 = 29%
Producer’s Accuracy • Map accuracy from the point of view of the map maker (PRODUCER). • How often are real features on the ground correctly shown on the map?
Producer’s Accuracy Can be computed (and reported) for each thematic class Producer accuracy = 100 – omission error Water: 100 – 36 = 64% Forest: 100 – 20 = 80% Urban: 100 – 4 = 96% Or PA = #correct/row total
User’s Accuracy • Accuracy from the point of view of a map USER (not a map maker). • How often is the type the map says should be there really there?
User’s Accuracy Can be computed (and reported) for each thematic class User accuracy = 100 – commission error Water: 100 – 22 = 78% Forest: 100 – 16 = 84% Urban: 100 – 29 = 71% Or UA = #correct/column total
Kappa Statistic • A measure of how accurate your map is above and beyond the accuracy expected by chance alone • Considers omission, commission, and overall accuracy • Frequently reported in the literature and used as a common way to compare maps
Kappa Statistic Kappa = (observed – expected)/(1 – expected) Observed is the overall accuracy from your contingency table (the sum of the diagonal)/(Total reference pixels) Expected is calculated from a matrix of “marginal products” Create a matrix by multiplying marginal totals. Expected = diagonal sum/total sum (from the marginal table) (See Campbell for calculation details)
Fuzzy Accuracy • Recognizes that binary accuracy assessment (right vs. wrong) discards important information • Can use scale of “rightness” or “wrongness” to get more nuanced accuracy assessment (e.g. absolutely right, good, reasonable, mostly wrong, absolutely wrong) • There are many fuzzy metrics that can capture this information numerically.
Accuracy Assessment -- Summary • Absolutely critical to any remote sensing based mapping project • Expensive – should be included in the budget from the start • Requires collection of accurate reference data either in the field or from higher resolution data • Analysis should include many aspects of accuracy to give users more information about the product.