Download
1 / 43
430 likes | 637 Vues
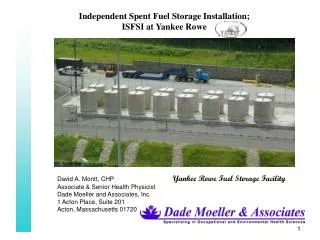
Various Methodologies for Calculating the Impacts on Delta-T From Independent Spent Fuel Storage Installations (ISFSI). Jim Holian and Steve Mirsky, SAIC. NUMUG Meeting San Francisco October 2009. Background. Original study performed for Cooper Nuclear Station (Nebraska Public Power)

E N D
Various Methodologies for Calculating the Impacts on Delta-T From Independent Spent Fuel Storage Installations (ISFSI) Jim Holian and Steve Mirsky, SAIC NUMUG Meeting San Francisco October 2009
Background • Original study performed for Cooper Nuclear Station (Nebraska Public Power) • Results presented at 2008 NUMUG in Charlotte • Study based on very conservative assumptions • Floods delayed new met tower construction • Additional study requested to reduce conservativeness in impact analyses
Three Methods Analyzed • Single-node adiabatic plume (initial study) • Multi-node plume with heat transfer (dilution) • Multi-node plume with heat transfer and buoyancy
Baseline • Based on NUHOMS Horizontal Storage Module (HSM) ISFSI Design • Other designs, i.e. Historm, VSC-24, NAC, may provide varying results due to different material, geometries, and flow areas • Calculations provided for comparisons between methods and are not specific to any plant
Factors Impacting Results Independent of Method • Distance from ISFSI to the met tower • Stability class distribution • Wind speed • Wind direction frequency • ISFSI heat load
Single Node Adiabatic Plume • First quick estimate of thermal impacts at the meteorological tower (if any) • No mixing with air outside plume • No heat loss/gain with surrounding air • Buoyancy is assumed zero • Only calculation node is at the cross section of plume where it intersects met tower
Key Assumption • HSM exit air temperature (HSMext) above ambient is linearly proportional to HSM heat load (HL) Hext = Actual HL /Design HL X Design HSMext Example: 50°F = 12 kW/24 kW X 100°F
Method 1 Calculation • The effect on air temperature at the met tower is the ratio of the flow rate at the HSMs (FRHSM) and the flow rate at the tower (FRTWR) along the insulated plume times HSMext: ΔTtwr = FRHSM/FRTWR X HSMext • FRTWR has huge influence on ΔTtwr
What Influences FRTWR? • Greatest is Stability - G stable plume cross section at a met tower 600 feet away is over 70 times smaller than an unstable A plume • Wind Speed • Combination of stable plume and light winds (typical nighttime scenario) results in large ΔTtwr
Met Tower ΔT (°F) at 500 Feet from ISFSI(8 HSMs – G & D Stability)
Met Tower ΔT (°F) at 150 Feet from ISFSI(10 HSMs – G & E Stability)
Multi-Node Plume With Heat Transfer • Includes heat transfer with air outside plume • Calculation node every 50 feet from ISFSI to met tower • No heat loss/gain with ground • Buoyancy is still assumed zero • Reduces some conservatism from Method 1
Heat Transfer Methodology • Determine flow area, heat transfer area, and plume volume for each node • Calculate the natural convection heat transfer correlation • Calculate the average and exit temperature of each node
Heat Transfer Calculations • Natural Convection Heat Transfer Coefficient Selected: HTC= 0.18 Δt0.333 • For each node, the heat transfer Q is: Qi = HTCi x Areai x Δti • Temperature change across the node is: Ti+1=Ti-Qi/Viρi cp where Vi is volume, ρi is density, and cp is air specific heat.
Heat Transfer Methodology Results • Reduced overall temperature change at tower by approximately 23% from simple adiabatic method (at 600 feet and 12 kW heat load for HSM geometry) • Demonstrates the impact of temperature change versus distance
Multi-Node Plume With Heat Transfer and Buoyancy • Utilizes same approach as the Heat Transfer Methodology except buoyancy is calculated into plume height • Reduces additional conservatism from first two methodologies
Buoyancy Methodology • Archimedes Law applied to each node • Calculate the vertical displacement of each node • Sum displacements to determine height of plume when it reaches met tower
Buoyancy Calculations • Determine Buoyancy Force for each node i: Fi=(ρout-ρiplume) Viplume g • Heated air buoyancy acceleration is: Aib= Fi/ Viρiplume • Vertical plume displacement for each node is: Zi=0.5 Aib t2
Buoyancy Results • Including buoyancy reduced the overall temperature change at tower by over 40% from the simple adiabatic method • In some instances, plume may go over tower, impact sensors at another level, or traverse between sensor levels • Extremely dependent on HSM heat load and wind speed
Impacts • Thermal impacts of HSM designed heat load dissipation – (direct thermal 24/7) • Structural – thousands of square feet of solid concrete in ISFSI HSMs sitting on a large concrete base often rimmed with gravel (passive thermal – urban heat island) • Physical – ISFSI size impacting wind speed and direction if inside 10:1 ratio (Reg. Guide 1.23). Usually not a large impact
NRC XOQDOQ Comparison • Ran standard Χ/Qs using 5 years of data • Added 0.4°F to ΔTto account for passive thermal impacts holding all other parameters equal • Added 3.0°F to ΔTonly when wind is blowing from ISFSI to account for direct thermal impacts holding all other parameters equal • Calculated the % change in sector Χ/Qs
Χ/Q Impact (%) When Lower Temperature Increased by 3.0°F for ISFSI to South of Tower
Conclusions • Various methods exist for calculating the change in temperature at the met tower from the ISFSI • The conservative adiabatic method provides a quick first estimate • The heat transfer method is less conservative and reduces the overall estimate by around 23% • Adding buoyancy to the adiabatic and heat transfer method reduces the estimate by over 40%, is the least conservative, and approximates the height of impact at the tower • Distance from the tower, stability, wind speed, and heat load have huge impacts on the results
Conclusions (cont’d) • Heat Transfer is most important in unstable to neutral environments with wind speeds > 2 m/s • Buoyancy has significant impacts in stable light wind conditions • The impact on downwind dose assessment is large for changes in temperature at the tower >0.4°F • In general, the analyses suggest that ISFSIs should be located further than 600 feet from the meteorological tower