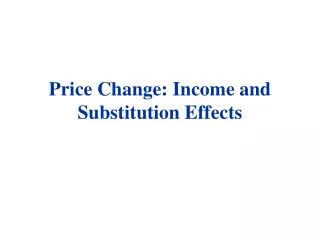
Income and Substitution Effects
470 likes | 678 Vues
Income and Substitution Effects. Engel Curves and the Slutsky Equation. Demand and income. X. If your income is initially X 1, you buy A 1 apples When your income rises to X 2 , you buy A 2 apples. To make the obvious point, demand is a function of income. X 2. X 1. I 2. I 1. A 2.

Income and Substitution Effects
E N D
Presentation Transcript
Income and Substitution Effects Engel Curves and the Slutsky Equation
Demand and income X • If your income is initially X1, you buy A1 apples • When your income rises to X2, you buy A2 apples. • To make the obvious point, demand is a function of income X2 X1 I2 I1 A2 A1
How demand rises with income • Lets plot the combinations of apples and income (X) from the previous graph. A2 A1 X1 X2
How demand rises with income • Lets plot the combinations of apples and income (X) from the previous graph. • Connecting all possible points, we get the Engel curve, giving demand as a function of income. A2 A1 X1 X2
The Shape of the Engel Curve A • The shape of the Engel Curve gives us the income elasticity of demand for the good • If the Engel Curve is a straight line, the income elasticity is 1.0 X
The Shape of the Engel Curve A • The shape of the Engel Curve gives us the income elasticity of demand for the good • If the Engel Curve has increasing slope the elasticity is greater than 1.0 X
The Shape of the Engel Curve A • The shape of the Engel Curve gives us the income elasticity of demand for the good • If the Engel Curve has decreasing slope the elasticity is less than 1.0 X
The Shape of the Engel Curve A • Of course the Engel Curve need not be so well behaved • This Engel Curve corresponds to a good that is both inferior and superior, depending on income X
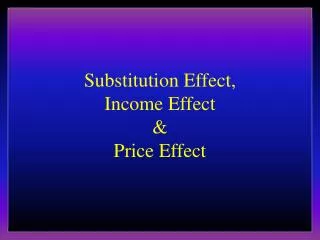
Income and Substitution Effects • We know that both price and income influence demand.
Income and Substitution Effects • We know that both price and income influence demand. • A price change means an income change.
Income and Substitution Effects • We know that both price and income influence demand. • A price change, means an income change. • You are purchasing 10 apples at $1 each. • If the price falls to 50¢, you effectively get $5 more income
Income and Substitution Effects • Let’s draw the indifference curves between money and apples. $ Yo I1 A Yo/pA
Income and Substitution Effects • Let’s draw the indifference curves between money and apples. • Your income is Yo; Apples initially cost pa $ Yo I1 A Yo/pA
Income and Substitution Effects • Let’s draw the indifference curves between money and apples. • Your income is Yo; Apples initially cost pa • You are are on indifference curve I1. $ Yo I1 A Yo/pA
Income and Substitution Effects • Suppose the price of apples drops to p*a $ Yo I2 I1 A Yo/p*A Yo/pA
Income and Substitution Effects • Suppose the price of apples drops to p*a • The budget line rotates out and you move to indifference curve I2. $ Yo I2 I1 A Yo/p*A Yo/pA
Income and Substitution Effects • Suppose the price of apples drops to p*a • The budget line rotates out and you move to indifference curve I2. • Two things have occurred: a price cut and an increase in income. $ Yo I2 I1 A Yo/p*A Yo/pA
Income and Substitution Effects • The substitution effect $ Yo I2 I1 A Yo/p*A Yo/pA
Income and Substitution Effects • The substitution effect • To isolate the effect of the lower price, imagine a budget line like the red line, reflecting the lower price but tangent to the old indifference curve. $ Yo I2 I1 A Yo/p*A Yo/pA
Income and Substitution Effects • The substitution effect • To isolate the effect of the lower price, imagine a budget line like the red line, reflecting the lower price but tangent to the old indifference curve. • The move to the red point on I1 shows the substitution effect. $ Yo I2 I1 A Yo/p*A Yo/pA
Income and Substitution Effects • The substitution effect is always negative • Diminishing MRS guarantees it $ Yo I2 I1 A Yo/p*A Yo/pA
Income and Substitution Effects • The substitution effect is always negative • The income effect • Of course, income has gone up as well, and the movement from the red point to the green point reflects that. $ Yo I2 I1 A Yo/p*A Yo/pA
Income and Substitution Effects • We effectively break the price change down into its two components. • The substitution effect • The income effect. $ Yo I2 I1 A Yo/p*A Yo/pA
Income and Substitution Effects • We effectively break the price change down into its two components. • The substitution effect • The income effect. • While the substitution effect is always negative, the income effect may or not be positive $ Yo I2 I1 A Yo/p*A Yo/pA
The Slutsky Equation • These effects are often summarized in the Slutsky equation
The Slutsky Equation • These effects are often summarized in the Slutsky equation • The substitution effect shows the change in demand from a movement along the indifference curve.
The Slutsky Equation • These effects are often summarized in the Slutsky equation • The income effect shows the change in demand from the effective increase in income.
An Application (Q/P) = 3/(-0.05) = - 60
An Application (Q/P) = - 60 Q(Q/I) = 50 (1) = 50
An Application (Q/P) = - 60 Q(Q/I) = 50 -60 (Q/P)U=Constant–50
An Application -60 (Q/P)U=Constant–50 (Q/P)U=Constant = -10
A Caution • The version of the Slutsky equation we use is only an approximation.
A Caution • The version of the Slutsky equation we use is only an approximation. • We are assuming discrete changes in price and income; the correct equation assumes infinitesimal changes.
Why spend time on this topic? • Giffin Goods
Why spend time on this topic? • Giffin Goods • The Demand for Leisure
Why spend time on this topic? • Giffin Goods • The Demand for Leisure • As wage rates increase, the cost of an hour of leisure increases • Demand goes up because the income effect dominates the substitution effect.
Why spend time on this topic? • Giffin Goods • The Demand for Leisure • Different Slopes .
Why spend time on this topic? • Giffin Goods • The Demand for Leisure • Different Slopes • Changes in the price of one brand versus changes in the prices of all brands. .
Why spend time on this topic? • Giffin Goods • The Demand for Leisure • Different Slopes • Changes in the price of one brand versus changes in the prices of all brands. • Heavily purchased goods versus lightly purchased goods.
A Final Point • The slope of the Marshallian, or uncompensated demand function
A Final Point • The slope of the Marshallian, or uncompensated demand function • The slope of the Hicksian, or compensated demand function. ©2003 Charles W. Upton