Download
1 / 25
250 likes | 274 Vues
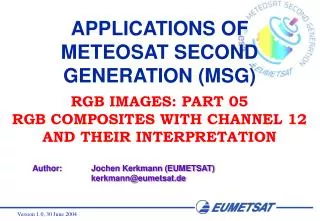
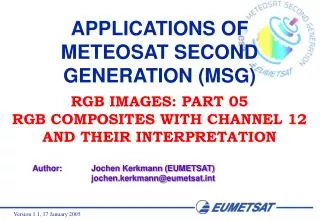
APPLICATIONS OF METEOSAT SECOND GENERATION (MSG). SQUALL LINES Author: Jochen Kerkmann (EUMETSAT) (kerkmann@eumetsat.de) Contributors: D. Rosenfeld (HUJ). Squall Line over Western Africa 14 July 2003. RGB NIR1.6-VIS0.8-VIS0.6 RGB VIS0.6-IR3.9-IR10.8.

E N D
APPLICATIONS OF METEOSAT SECOND GENERATION (MSG) SQUALL LINES Author: Jochen Kerkmann (EUMETSAT) (kerkmann@eumetsat.de) Contributors: D. Rosenfeld (HUJ)
Squall Line over Western Africa 14 July 2003
RGB NIR1.6-VIS0.8-VIS0.6 RGB VIS0.6-IR3.9-IR10.8 MSG-1, 14 July 2003, 10:00 UTC Squall Line over Western Africa causing violent rainfall and sandstorms
Click on the image to see the animation ! Warm Cold MSG-1, 14 July 2003, 02:00-08:45 UTC, IR10.8
Global View Squall Line difference IR6.2 - IR 10.8 [K] difference IR7.3 - IR10.8 [K] MSG-1, 14 July 2003, 02:00 UTC
Zoom on Western Africa Very high (overshooting) Tops difference IR6.2 - IR 10.8 [K] difference IR7.3 - IR10.8 [K] MSG-1, 14 July 2003, 02:00 UTC
Highest Tops MSG-1 14 July 2003 02:00 UTC Difference Image IR6.2 - IR 7.3
Global View Sand Storm Squall Line difference IR8.7 - IR 10.8 [K] difference IR3.9 - IR10.8 [K] MSG-1, 14 July 2003, 02:00 UTC
Zoom on Western Africa Sand Storm Thin Cirrus Thin Cirrus Thick Ice Clouds Noise in Channel 04 difference IR8.7 - IR 10.8 [K] difference IR3.9 - IR10.8 [K] MSG-1, 14 July 2003, 02:00 UTC
Click on the image to see the animation ! MSG-1, 14 July 2003, 02:00-08:30 UTC, difference IR8.7 - IR10.8 [K]
1= Very high, cold ice clouds with small ice particles (developing stage, intense precipitation) 2= very high, cold ice clouds with large ice particles (decaying stage) 3= Thin Cirrus 4= Altocumulus with thin borders 5= Sand storm 4 5 3 3 2 1 1 3 1 3 2 MSG-1 14 July 2003 10:00 UTC RGB Composite R = WV6.2 - WV7.3 G = IR3.9 - IR10.8 B = NIR1.6 - VIS0.6 1 2 1
1= Very high, cold ice clouds with small ice particles (developing stage, intense precipitation) 2= very high, cold ice clouds with large ice particles (decaying stage) 3= Thin Cirrus 4= Altocumulus with thin borders 5= Sand storm 4 5 3 3 2 1 1 3 1 3 2 1 MSG-1 14 July 2003 10:00 UTC Channel 01 (VIS0.6) 2 1
1= Very high, cold ice clouds with small ice particles (developing stage, intense precipitation) 2= very high, cold ice clouds with large ice particles (decaying stage) 3= Thin Cirrus 4= Altocumulus with thin borders 5= Sand storm 4 5 3 3 2 1 1 3 1 3 2 1 MSG-1 14 July 2003 10:00 UTC Channel 09 (IR10.8) 2 1
1= Very high, cold ice clouds with small ice particles (developing stage, intense precipitation) 2= very high, cold ice clouds with large ice particles (decaying stage) 3= Thin Cirrus 4= Altocumulus with thin borders 5= Sand storm 4 5 3 3 2 1 1 3 1 3 2 1 MSG-1 14 July 2003 10:00 UTC Difference Image WV6.2 - WV7.3 2 1
1= Very high, cold ice clouds with small ice particles (developing stage, intense precipitation) 2= very high, cold ice clouds with large ice particles (decaying stage) 3= Thin Cirrus 4= Altocumulus with thin borders 5= Sand storm 4 5 3 3 2 1 1 3 1 3 2 1 MSG-1 14 July 2003 10:00 UTC Difference Image IR3.9 - IR10.8 2 1
1= Very high, cold ice clouds with small ice particles (developing stage, intense precipitation) 2= very high, cold ice clouds with large ice particles (decaying stage) 3= Thin Cirrus 4= Altocumulus with thin borders 5= Sand storm 4 5 3 3 2 1 1 3 1 3 2 1 MSG-1 14 July 2003 10:00 UTC Difference Image NIR1.6 - VIS0.6 2 1
1= Very high, cold ice clouds with small ice particles (developing stage, intense precipitation) 2= very high, cold ice clouds with large ice particles (decaying stage) 3= Thin Cirrus 4= Altocumulus with thin borders 5= Sand storm 4 5 3 3 2 1 1 3 1 3 2 1 MSG-1 14 July 2003 10:00 UTC Difference Image IR12.0 - IR10.8 2 1
1= Very high, cold ice clouds with small ice particles (developing stage, intense precipitation) 2= very high, cold ice clouds with large ice particles (decaying stage) 3= Thin Cirrus 4= Altocumulus with thin borders 5= Sand storm 4 5 3 3 2 1 1 3 1 3 2 1 MSG-1 14 July 2003 10:00 UTC Difference Image IR8.7 - IR10.8 2 1
1= Very high, cold ice clouds with small ice particles (developing stage, intense precipitation) 2= very high, cold ice clouds with large ice particles (decaying stage) 3= Thin Cirrus 4= Altocumulus with thin borders 5= Sand storm 4 5 3 3 2 1 1 3 1 3 2 1 MSG-1 14 July 2003 10:00 UTC Difference Image IR8.7 - IR10.8 2 1
1= Very high, cold ice clouds with small ice particles (developing stage, intense precipitation) 2= very high, cold ice clouds with large ice particles (decaying stage) 3= Thin Cirrus 4= Altocumulus with thin borders 5= Sand storm 4 5 3 3 2 1 1 3 1 3 2 MSG-1 14 July 2003 10:00 UTC RGB Composite R = IR12.0 - IR10.8 G = IR10.8 - IR3.9 B = WV7.3 - WV6.2 1 2 1
Squall Line over Central Africa 20 May 2003
Chad Sudan Central African Republic Cameroon Squall Line Dem. Republic of the Kongo Congo MSG-1, 20 May 2003, 14:00 UTC, RGB VIS0.6 / IR3.9i / IR12.0i Effect of different enhancements
Click on the image to see the animation ! MSG-1 20 May 2003 12:00 - 14:30 UTC RGB Composite R = VIS0.6 G = NIR1.6 B = IR3.9i
Monitoring of Squall Lines • IR10.8 to get info on cloud top temperature/height • WV6.2-IR10.8 and WV6.2-WV7.3 to identify highest tops • HRVIS to see detailed structures • NIR1.6 and IR3.9 (solar component) to get information on phase and particle size • IR3.9 - IR10.8 to find areas with most intense development/precipitation • RGBs to monitor cloud types and convective development: • RGB 01/03/09 (Day) or RGB 01/04/09 (Day) • RGB 05-06/04-09/03-01 (Day) • RGB 10-09/09-04/09 (Day & Night) • RGB 10-09/09-04/06-05 (Day & Night)