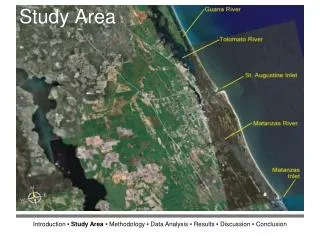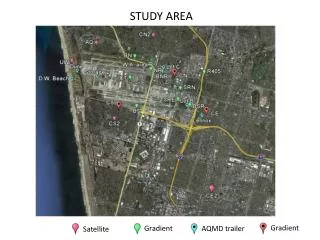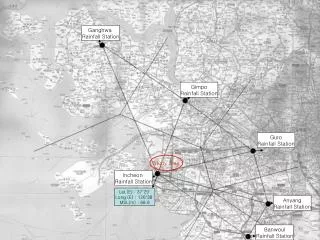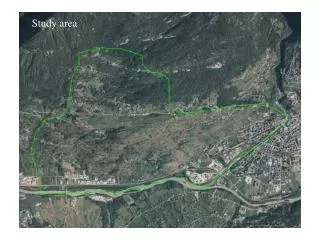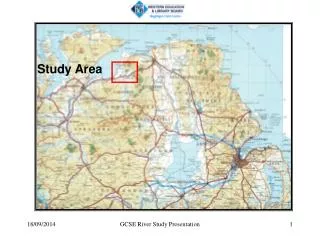
The study area
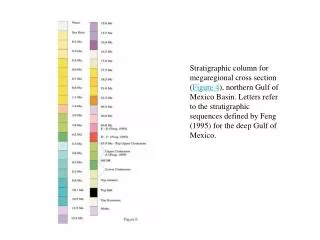
Stratigraphic column for megaregional cross section ( Figure 4 ), northern Gulf of Mexico Basin. Letters refer to the stratigraphic sequences defined by Feng (1995) for the deep Gulf of Mexico. The study area.

The study area
E N D
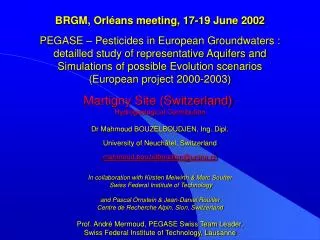
Presentation Transcript
Stratigraphic column for megaregional cross section (Figure 4), northern Gulf of Mexico Basin. Letters refer to the stratigraphic sequences defined by Feng (1995) for the deep Gulf of Mexico.
1:1 depth section and sequential restorations of seismic profile C from regional study area (see Figure 3 for location). The restorations show the evolution of a central salt stock into a bowl-shaped minibasin, and how this evolution influenced petroleum migration pathways through time. Arrows represent petroleum migration pathways at the time of each restoration. Migration is believed to be vertical until it reaches the base of salt (in black), at which point it is deflected up the dip along the base of salt. Vertical migration is believed to resume when and where salt welds form. The evolution of salt concentrates petroleum migration in some regions through time, whereas salt shields suprasalt sediments from petroleum migration for significant amounts of time. Changes in length of suprasalt section show amounts of extension and contraction.
Generalized stratigraphic framework of the northern Gulf of Mexico Basin with reservoirs and probable source intervals highlighted. Modified from Piggott and Pulham (1993). MCSB = middle Cretaceous sequence boundary.
Events chart for the petroleum systems within the northern Green Canyon/Ewing Bank study area showing the temporal relationships of the essential elements and processes. Preservation time represents time since initial critical moment of peak generation. Critical moments represent the time each source rock experienced peak oil generation (0.90–0.95 %Ro) as shown in Figure 12, Figure 13, and Figure 16.