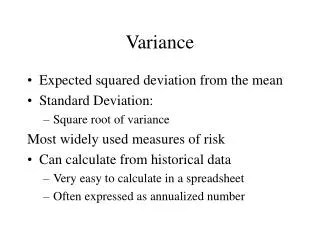
Variance Estimation
Optimal Number of Replicates for Variance Estimation Mansour Fahimi, Darryl Creel, Peter Siegel, Matt Westlake, Ruby Johnson, and Jim Chromy Third International Conference on Establishment Surveys (ICES-III) June 21, 2007. Variance Estimation.

Variance Estimation
E N D
Presentation Transcript
Optimal Number of Replicates for Variance EstimationMansour Fahimi, Darryl Creel, Peter Siegel, Matt Westlake, Ruby Johnson, and Jim ChromyThird International Conference on Establishment Surveys(ICES-III)June 21, 2007
Variance Estimation • Two general approaches for variance estimation With weighted data obtained under complex designs: • Linearization • Replication
Linearization • Approximate complex statistics in terms of L linear statistics • Estimate variance of from:
Replication • Partition the full sample into R subsamples (replicates) • Obtain separate estimates forfrom each replicate: • Estimate variance of by:
How Many Replicates? • Recommendations regarding the optimal number of replicates for variance estimation are at variance: • Computational resources required can be intensive • For certain statistics a larger number of replicates might be needed to produce stable estimates of variance • What is the point of diminishing returns?
Research Methodology • Relying on two complex establishment surveys, this work presents an array of empirical results regarding the number of bootstrap replicates for variance estimation: • National Study of Postsecondary Faculty (NSOPF:04) • National Postsecondary Student Aid Study (NPSAS:04)
General Design SpecificationsNational Study of Postsecondary Faculty (NSOPF:04) • Survey of about 35,000 faculty and instructional staff • Across a sample of 1,080 institutions • In the 50 States and the District of Columbia
Sampling Methodology • Institutions selected with probability proportional to a measure of size to over-represent: • Hispanic • Non-Hispanic Black • Asian and Pacific Islander • Full-time other female • Used RTI’s cost/variance optimization procedure for sample allocation
Target Number of Respondentsby Institution and Faculty Strata
Distribution of Respondents(by institution and faculty strata)
Variance Estimation Methodology(NSOPF:04) • Used methodology developed by Kaufman (2004) to create bootstrap replicate weights: • Reflected finite population correction adjustment for the first stage (institution) selection. • Second stage (faculty selection) finite population correction factors were close to one and not reflected. • Produced 65 bootstrap replicates to meet Data Analysis System (DAS) requirements of NCES. • Calculated standard error of several statistics using the above bootstrap replicates and Taylor linearization method in SUDAAN.
Comparisons of Variance EstimatesSE of Percent Teaching as Principal Activity by Rank(Bootstrap vs. Linearization)
Comparisons of Variance EstimatesSE of Percent Research as Principal Activity by Rank(Bootstrap vs. Linearization)
Comparisons of Variance EstimatesSE of Percent Administration as Principal Activity by Rank(Bootstrap vs. Linearization)
Comparisons of Variance EstimatesSE of Percent Full-time by Institution Type (Bootstrap vs. Linearization)
Revised Variance Estimation Methodology(NSOPF:04) • Used methodology developed by Kaufman (2004) to create 200 bootstrap replicate weights. • Used 10, 11, …., 200 replicates to estimate relative standard error (RSE) of different statistics. • Repeated the above using 9 random permutations of replicates to estimate RSE of the same statistics. • Used Taylor linearization to estimate relative standard error of estimates via SUDAAN.
RSE of Percent Asians by Number of Replicates(Taylor Linearization and Permutations of Replicates)
RSE of Percent Age < 35 by Number of Replicates(Taylor Linearization and Permutations of Replicates)
RSE of Percent Citizen by Number of Replicates(Taylor Linearization and Permutations of Replicates)
RSE of Percent Full-time by Number of Replicates(Taylor Linearization and Permutations of Replicates)
RSE of Percent Master’s by Number of Replicates(Taylor Linearization and Permutations of Replicates)
RSE of Percent Teaching as Principal Activity by Number of Replicates
RSE of Percent Teaching as Principal Activity by Number of Replicates(Taylor Linearization and Permutations of Replicates)
RSE of Mean Income by Number of Replicates(Taylor Linearization and Permutations of Replicates)
RSE of Median Income by Number of Replicates(Taylor Linearization and Permutations of Replicates)
RSE of Regression InterceptIncome = Hours + Race + Hours Race
RSE of Regression InterceptIncome = Hours + Race + Hours Race(Taylor Linearization and Permutations of Replicates)
RSE of Regression Slope (Hours)Income = Hours + Race + Hours Race
RSE of Regression Slope (Hours)Income = Hours + Race + Hours Race(Taylor Linearization and Permutations of Replicates)
RSE of Regression Slope (Race)Income = Hours + Race + Hours Race
RSE of Regression Slope (Race)Income = Hours + Race + Hours Race(Taylor Linearization and Permutations of Replicates)
RSE of Regression Slope (Hours Race)Income = Hours + Race + Hours Race
RSE of Regression Slope (Hours Race)Income = Hours + Race + Hours Race(Taylor Linearization and Permutations of Replicates)
Conclusions(Rough & Interim) • Complex statistics do require more replicates for stable variance estimation • It seems that: • 64 replicates might be inadequate • 200 replicates seem to be overkill • Somewhere between 100 to 200 replicates might be sufficient