Regents Item Analysis Reports
800 likes | 975 Vues
Regents Item Analysis Reports. CFN 603 – Larry Pendergast, Network Leader Gary Carlin gcarlin@schools.nyc.gov Michael Tancredi Mtancre@schools.nyc.gov. A Definition …. Assessment is a process of gathering and documenting information ( data ) about the: Achievement Skills Abilities

Regents Item Analysis Reports
E N D
Presentation Transcript
Regents Item Analysis Reports CFN 603 – Larry Pendergast, Network Leader Gary Carlin gcarlin@schools.nyc.gov Michael Tancredi Mtancre@schools.nyc.gov
A Definition … • Assessment is a process of gathering and documenting information (data) about the: • Achievement • Skills • Abilities • Personality variables of an individual
Assessments Allow Us … • to learn more about the competencies and deficiencies of the individual being tested. • to identify specific problem areas and/or needs. • to evaluate the individual's performance in relation to others, a set of standards or goals.
And Also … • Provide teachers with feedback on effectiveness of: • Instruction • Equity Strategies • Interventions • Predict an individual's aptitudes or future capabilities.
It’s All About Data “Data literacy” means that a person possesses a basic understanding of how data can be used to inform instruction.
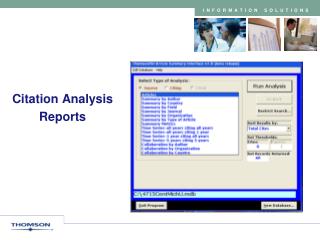
ARIS Private Community • This will be done for you by your supervisor! • Need to download the tool that was uploaded into your ARIS private community • Enable all the macros of the tool
Tool Tabs • Tab for each of the Regents subject areas (only scanned exams) • Click on tab: all students who were registered to take the exam • Will NOT show students who took a Regents at another school
These columns display the content information each question is linked to. This section shows you the question type (MC, CR, etc), question #, and the correct answer. For multiple choice questions, this section shows you the percentage of students who selected each answer choice. The percentage of students who answered correctly is in the ‘check’ column. This section displays individual student answer selections. Incorrect answers are shaded white. Answers that read ‘M’, ‘-‘, or ‘X’ mean students either left it blank or bubbled in more than one answer. Students who were registered for the exam but did not submit an answer sheet will not have information in this section.
Student Information • Student Name, OSIS number, and DBN of school they were active in at time of test • IEP & ELL status: ‘0’ - No, ‘1’ - Yes. • Ethnicity code: numerically (before last school yr) and by letter (past school yr). • Status: ‘A’ – active, ‘D’ - discharged students • Cohort and Grade Level (at time of test) • Score: Each student’s cumulative score. 65+ (green); 55-64 (yellow). At the top of row (S), the average score earned by a student.
Ethnicity (# - before last school yr) • 1 – American Indian or Alaskan Native • 2 – Asian or Pacific Islander • 3 – Hispanic • 4 – Black (not of Hispanic origin) • 5 - White (not of hispanic origin) • 6 - Parent refused to sign • 7 – Multi-Racial
Ethnicity (letter - past school yr) • A – Hispanic • B – American Indian or Alaskan Native • C – Asian • D – Native Hawaiian or Other Pacific Islander • E – Black • F – White • G – Multi – Racial • Other
Cohort • N - 2008 • O - 2009 • P - 2010 • Q - 2011 • R - 2012
For Each Question # … • Content Standard (strand.) • Question Type (T); MC, CR, etc. • Question Number (#) • Correct Answer ( ) A, B, C, D • Distractor Analysis (A, B, C, D) • Correct Answer ( ) % Correct (G,Y,R) • Individual Student Answers (A, B, C, D)
Individual Student Answers • Incorrect – White • Correct – Light Green • M – Multiple Answers • X – Missing Answer (left blank) • (-) - ???
Row • Green - High • Yellow - Middle • Red - Low
Multiple Choice Tests • “Well-designed multiple choice tests are generally more valid and reliable than essay tests …” • they sample material more broadly • discrimination between performance levels is easier to determine • scoring consistency is virtually guaranteed” The Center for Teaching and Learning, UNC, 1990
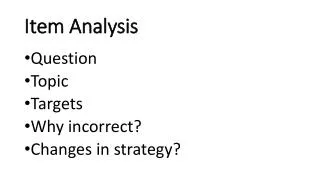
Item Analysis • A method of assessment of how a question on a test measures the performance of a student. • Analyzing each item on a test to determine the proportions of students selecting each answer. • Evaluate student strengths and weaknesses;
Main Uses of Regents Examination Item Analysis • Understanding patterns of achievement in your school-wide Regents performance • Identifying particular areas in which students need assistance in
What Does Item Analysis Tell Us? • Questions students were guessing on. • Most difficult questions (reteach). • Misconceptions based on incorrect responses. • Areas of strength (compact). • Flaws in the test (eliminate, not count). • “… it is five times faster to revise items that didn’t work, using item analysis, than trying to replace it with a completely new question.”
In Addition … • The proportion of students answering an item correctly affects its discrimination power. • Items answered correctly or incorrectly by a large proportions of students (+85%) have markedly reduced power to discriminate. • For optimum discrimination power comes from items that will be answered correctly by 30% to 80% of the students.
Multiple-Choice Stem • Poses a problem or states a question. • Direct questions are best, but incomplete statements are necessary sometimes. • Rule: Students should be able to understand the question without reading it several times and without having to read all the options.
Distractors • Incorrect choices for a test item. • A distractor should be selected (no less than 5% of total) by some of the students for all test questions. • Information on the (frequency of) selection can help teachers identify student/class/school misconceptions and problems.
Remember the Standards • Assessments must be valid in accurately assessing what students learn in relation to the standards. • Instructional unit objectives must be linked to the state content standards.
Activity # Interpreting the Item Analysis
1. Ambiguous Items • Almost equal numbers of students choose A (6). • Students didn’t know material? • Item was defective? –could be defensible. • Reteach/Rescore
2. Equal Responses • Students are responding about equally to all alternatives. • Guessing? • Wasn’t taught yet. • Too difficult. • Too badly written. • Remove/Rescore • Reteach • Occasional challenge question – top students
3. Distractors Not Chosen • No one selected D. • Replace alternative D. • If a 4th distractor is NOT possible, use 3 or don’t reuse item. • Each distractor should attract at least 5% of the students!!!
4. Distractor Too Attractive • Too many students (Upper and Lower) select A. • No one distractor should get more than the key (or more than about half the students). • Use this time. • Weaken distractor in the future.
5. Too Easy • Almost everyone got the question correct (Upper and Lower). • Won’t discriminate well. Difficult is over 85% it’s of little value. • Remember the higher the Difficulty Index – the easier the question. • Too Difficult = 30% - 35%
6. Omitted Questions • Omitted test questions. • Were they near the end of the test? On the back of the page? (format problem) • Was the test too long or too difficult?
Before Viewing IA • Provide subject area teachers with a copy of their specific Regents examinations. • Task: • Identify 5 questions (each) from the M/C section that they believe students would find the … • “Least Challenging” (circle) – Why? • “Most Challenging” (star) – Why?
Why are the Distractors Attractive? - Cross out answer box - List “attractive” characteristics
Next … • Put your 5 Most/Least Challenging questions into RANK ORDER. • “Least Challenging” • 1. Easiest --- 5. More Complex • “Most Challenging” – • 1. Hardest --- 5. Less Complex
Now … • For each question, put the answer choices (1, 2,3, 4) for each question into rank order based on what you believe will be the student’s frequency of response for your students. • 1- most frequent --- 4 – least frequent • Explain your ranking
Distractor AttentionThe distractor that attracted the …