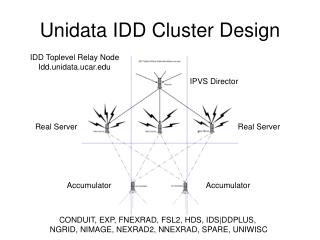
Enhancing Performance Through Designing Design: A Comprehensive Analysis
Learn about the E2 and DAM performance models, crafting, parametric, and optimization in design, and the link between design and management. Explore activities, resources, and analysis for improved efficiency and effectiveness in product development.

Enhancing Performance Through Designing Design: A Comprehensive Analysis
E N D
Presentation Transcript
9th February 2005 EPSRC Design Performance Cluster 2005 Mark Haffey (Alex Duffy) CAD Centre, DMEM University of Strathclyde
Contents • Performance analysis (E2 and DAM) • PERFORM • Designing design • (craft, parametric and optimisation) • Conclusion Axioms: • Activities are the fundamental means of performance • Design and its management are inextricably linked
Task Goals/ Constraints Activity Input Output Resources the E2 Performance Model Effectiveness () Performance analysis Efficiency ()
RANGE LEVEL Product Development Program Project A Phase Activity Scope of analysis Performance analysis
DG DAG DI DO Product Development DAI DAO DR DAR the E2 Performance Model Performance analysis D - Design KID DA - Design Activity KID KID: Knowledge, Information and Data
the E2and DAM models G Design Development Performance analysis I O R
the E2and DAM models DG DAG 3 Design Effectiveness () DO DI Design Activity Design Process Effectiveness () DAO DAI Design Management Activity 1 2 4 DR DAR Stop G Managed Activity Performance analysis I O R
% of Total Ideal 0.00 0.50 1.00 1.50 2.00 2.50 3.00 3.50 2.5 2.0 1.5 1.0 0.5 0.0 Ideal Current Prioritised Goals Facilitator(s) PERFORM System • Tools • CAD • EDM • Email • …... 4.0 • Methods • DFX • QFD • …... Co-location 3.5 Info integ'n & sharing 3.0 3.0 2.8 PDM/EDM 2.5 Contribution % of Total (Ideal) 2.2 2.2 2.0 2.0 1.9 Shared workspace • Approaches • Concurrent • Engineering • Decision • Support • …… Analysis Team 1.5 Standardisation • Assessment 1.0 0.8 Tool integ'n 0.5 0.0 Web page 0.0 1.0 2.0 3.0 4.0 5.0 Ease Customer needs - PERFORM Goal Definition • Specification • Selection of Target Areas Customer needs Resource Definition • Analysis • Presentation • Review
Through performance analysis metrics of the design activity or process can be defined Like product design, performance targets can be set and the process designed to meet those targets Different approaches can be used for designing design, such as: Craft based Parametric Optimisation Performance and designing design Designing design
Measures and values of efficiency & effectiveness % of Total Ideal 0.00 0.50 1.00 1.50 2.00 2.50 3.00 3.50 2.5 2.0 1.5 1.0 0.5 (Ad) 0.0 Ideal Current (Ad) (Ad) (Am) (Am) 4.0 Co-location 3.5 Info integ'n & sharing 3.0 3.0 2.8 PDM/EDM 2.5 Contribution % of Total (Ideal) 2.2 2.2 (Am) 2.0 2.0 1.9 Shared workspace 1.5 Standardisation 1.0 Areas for Improvement in Efficiency & Effectiveness 0.8 Tool integ'n 0.5 0.0 Web page 0.0 1.0 2.0 3.0 4.0 5.0 Ease Craft based design Designing design
Measures and values of efficiency & effectiveness (Ad) Performance model (Ad) (Ad) (Am) (Am) Re-engineering/Re-designing (Am) Process Improvements ( and ) Parametric based design Designing design
Activity 1.54 Resource X.1 Duration 1.67 a Activity Alpha Resource none Duration 0.11 b d c Activity ffd Resource CVB Duration 100.0 e Activity ysw Resource P3222 Duration 9.999 f Directed Graphs IDEF Process optimisation A number of process modelling techniques exist, such as: Designing design These techniques could generally be described as being qualitative and offer no direct mechanisms for a quantitative assessment and optimisation of the process.
Task 1 Task 2 Task 3 Task 4 Task 5 Task 6 Task 7 Task 8 Task 9 Task 10 Task 1 Task 2 Task 3 Task 4 Task 5 Task 6 Task 7 Task 8 Task 9 Task 10 Process optimisation The DSM is generic and due to its compactness and easily quantifiable nature, has seen considerable use in the analysis and management of the product development process. The DSM consists of a sequence of activities that are represented in the same order in both the row and column of the matrix. Designing design The central part of the matrix represents the dependencies between the activities. Iteration exists within the process as feed-back dependencies.
Process optimisation – Ship design Designing design Iteration Criteria: 35870000 Iteration Criteria: 8960000 75% Reduction Before Optimisation After Optimisation
Presented on-going work to improve the design process through “designing design” Defined clear relations between goals, activities, resources, and tasks Design is a managed activity Performance is efficiency and effectiveness. Provides measures for ‘design analysis’ Customer needs identified through PERFORM analysis Approaches to ‘designing design’ presented: Craft Parametric Optimisation based Conclusion Conclusion