
EXAMPLE 1
E N D
Presentation Transcript
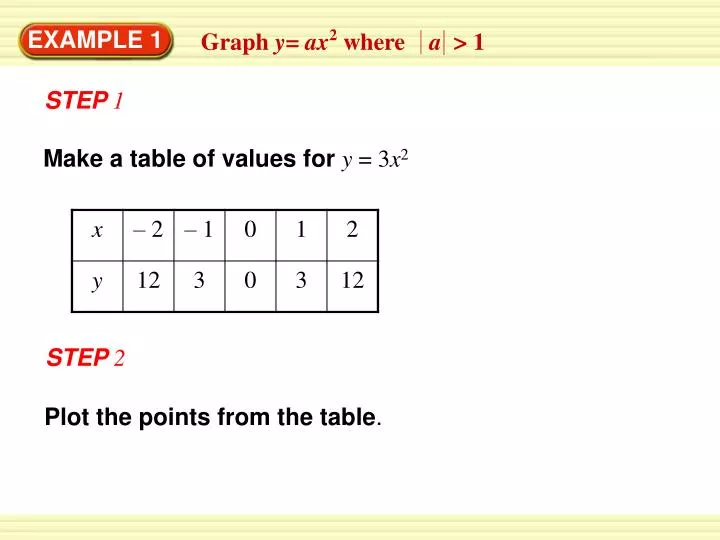
Graph y= ax2 where a > 1 EXAMPLE 1 STEP 1 Make a table of values for y =3x2 STEP 2 Plot the points from the table.
Graph y= ax2 where a > 1 EXAMPLE 1 STEP 3 Draw a smooth curve through the points. STEP 4 Compare the graphs of y = 3x2and y = x2. Both graphs open up and have the same vertex, (0, 0), and axis of symmetry, x = 0. The graph of y = 3x2 is narrower than the graph of y =x2 because the graph of y = 3x2 is a vertical stretch (by a factor of 3) of the graph of y =x2.
Graph y =ax2 where a < 1 – x2. Graph y= Compare the graph with the graph of 1 1 y = x2. 4 4 – x2. Make a table of values for y = EXAMPLE 2 STEP 1
Graph y =ax2 where a < 1 EXAMPLE 2 STEP 2 Plot the points from the table. STEP 3 Draw a smooth curve through the points.
Graph y =ax2 where a < 1 1 1 1 4 4 4 andy =x2. Compare the graphs ofy = 1 – Both graphs have the same vertex (0, 0), and the same axis of symmetry, x = 0. However, the graph of x2. 4 – – x2 x2 is wider than the graph of y =x2 and it opens down. This is because the graph of is a vertical shrink with a reflection in the x-axis of the graph of y =x2. by a factor of y = y = EXAMPLE 2 STEP 4
EXAMPLE 3 Graph y = x2 + c Graph y = x2+ 5. Compare the graph with the graph of y = x2. STEP 1 Make a table of values for y =x2+ 5.
EXAMPLE 3 Graph y = x2 + c STEP 2 Plot the points from the table. STEP 3 Draw a smooth curve through the points.
EXAMPLE 3 Graph y = x2 + c STEP 4 Compare the graphs of y = x2+ 5and y = x2.Both graphs open up and have the same axis of symmetry, x = 0. However, the vertex of the graph of y =x2+ 5,(0, 5), is different than the vertex of the graph of y =x2,(0, 0), because the graph of y =x2 + 5 is a vertical translation (of 5 units up) of the graph of y =x2.
ANSWER for Examples 1, 2 and 3 GUIDED PRACTICE Graph the function. Compare thegraph with the graph ofx2. 1. y=–4x2
2. y = x2 ANSWER 1 3 for Examples 1, 2 and 3 GUIDED PRACTICE Graph the function. Compare thegraph with the graph ofx2.
for Examples 1, 2 and 3 GUIDED PRACTICE Graph the function. Compare thegraph with the graph ofx2. 3. y =x2 +2 ANSWER


