Download
1 / 16
160 likes | 334 Vues
American Indian/Alaska Native Epidemiological Profile. Jennifer Kawatu , RN, MPH November 9, 2011. Background. National Chlamydia rates for men and women 2009. 4.5 X. National Objective of IPP Infrastructure: Epidemiological Profile of American Indian/Native Alaskans . White.

E N D
American Indian/Alaska NativeEpidemiological Profile Jennifer Kawatu, RN, MPH November 9, 2011 www.jsi.com
Background National Chlamydia rates for men and women 2009 4.5 X National Objective of IPP Infrastructure: Epidemiological Profile of American Indian/Native Alaskans White American Indian / Alaska Native Sources: For men and women, 15 and older, in US and outlying areas. US Department of Health and Human Services, Centers for Disease Control and Prevention, National Center for HIV, STD and TB Prevention (NCHSTP), Division of STD/HIV Prevention, Sexually Transmitted Disease Morbidity for selected STDs by age, race/ethnicity and gender 1996-2009, CDC WONDER On-line Database, June 2011. Accessed at http://wonder.cdc.gov/std-std-race-age.html on Oct 5, 2011 1:35:43 PM
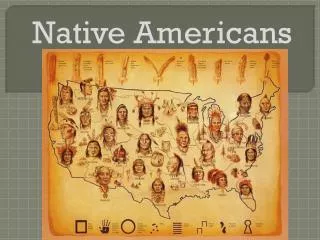
American Indians/Alaska Nativesin Region I • AI/AN make up less than 1% of population in Region I ( ~ 0.3%) • 560 Federally recognized tribes • Many others with state or no official recognition • American Indians from all over the country live in Region I Source: Census, 2010.
Region I AI/AN Population Density Green=Densest AI/AN populations in rural areas Source: U.S. Census
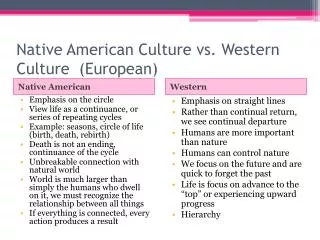
Socioeconomics AI/AN more likely than Whites to: • Live in poverty • Have lower median family incomes • Have fewer years of education • Be Younger
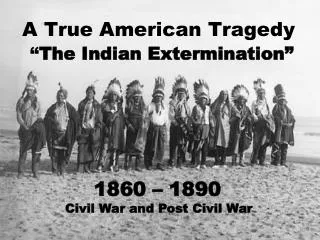
History • AI/AN population, has a distinct history with the federal government • Snyder Act of 1921 led to development of Indian Health Service (IHS) • IHS serves almost 2 million members of the 564 federally recognized AI/AN tribes. • IHS Direct Care • Tribally Managed Services • Tribal Services • Urban Indian Health Programs
Cultural • Contracted with Medical Anthropologist with extensive experience working with native population in Northeast to conduct KII • Between Feb-May, 2011 conducted 7 interviews with residents of all six states • Purpose of interviews to identify: • Barriers to care • Perceptions and beliefs about STI/Family planning care • Opportunities to partner with IPP
Cross Regional Messages from KIIs • Transportation challenges for rural and youth populations • Fears of breached confidentiality may affect utilization choices • Concerns of perceived illness connected to stigma, socio-cultural prejudice, and racism may incline individuals to not identify as Natives among non-Natives. • Concerns about identity may alter the use of non-Native STD services. Both of these situations can and do skew associated statistics.
Cross Regional Messages from KIIs • Appropriate messaging must be culturally relevant and competent. • Messengers gender and tribal specific • Consider Message technology, methods of dissemination, and literacy levels. • More rural, older and northern populations tend to emphasize personal oral transmission of knowledge and information. • Southern, as opposed to urban, communities may have greater access to education through smart phones and internet technologies.
Chlamydia Positivity among AI/AN Percent Positive for Chlamydia among AI/AN* IPP Females Region I 2005-2009 *Includes AI/AN only or AI/AN along with another race
Region I Chlamydia Positivity Rates in Women 24/25 and Younger by Race (2005-2009)
Conclusions • AI/AN populations in Region I are small and very diverse group • AI/AN make up less than 1% of population in general, and less than 1% of population tested for Chlamydia • Reaching 2% of AI/AN in the under 24/25 age group – room to expand
Conclusions Cont. If funds and personnel available improve outreach to AI/AN: • Have additional conversations with tribal health contacts to elicit culturally specific message content. • Collaborate with tribal health leaders to disseminate messages using locally specific approaches. E.g. Project Red Talon in Oregon • Timelines should consider time to build relationships with AI/AN organizations http://www.npaihb.org/epicenter/project/project_red_talon/
Conclusions Cont. • Non-Native facilities should actively train staff about perceived discrimination and its impact on Native clients. • Media messages should address both genders and a variety of ages. Multi-generational audiences might encourage other participants to actively engage in education. • Messages should “normalize” and de-stigmatize prevention and screening services and education.