Download
1 / 12
120 likes | 247 Vues
Characterization of n_TOF fission samples. National Technical University of Athens, Department of Physics, Athens, Greece. Rosa Vlastou. Characterization.

E N D
Characterization of n_TOF fission samples National Technical University of Athens, Department of Physics, Athens, Greece Rosa Vlastou
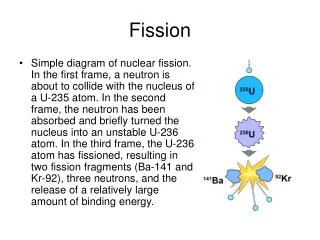
Characterization 1. Homogeneity Using CR-39 plastic track detectors2. Mass – ContaminationUsing alpha-spectroscopy and Rutherford Back Scattering The targets were thin layers of 100% enriched isotopes depοsited on 100μm thick Al backing using the painting technique
1. Homogeneity K.Ioannidis & K.Stamoulis : University of Ioannina CR-39 track plastic detectors, placed on top of the samples for a few seconds to a few hours, depending on the activity of the sample, in order to achieve a surface tracks’ concentration of at least 200 tracks/mm2. 237Np: activity 1.3x10 5 Bq4 min exposure time 234U : activity 2x10 6 Bq 16 sec exposure time 238U : activity 360Bq 24 hours exposure time The detectors were etched in a 6 N aqueous NaOH solution, maintained at 75 °C in a water bath with a temperature control better than 1°C. Then a number of images of the detectors’ surfaces were captured with the use of a microscope - video camera - frame grabber - computer recording arrangement.
To construct the following diagrams, images were captured every 5 mm. Then the images were automatically analyzed using the TRIAC II software to count the number of tracks per 5x5 mm2 5.2 cm diameter 8 cm diameter Homogeneous distribution within 7-9%
2. Mass – ContaminationM.Diakaki , R.VlastouUsing alpha-spectroscopy, in a scattering chamber at a vacuum ~10-2 Torr 80mm2 Si Surface Barrier detector with a Ta mask of 4mm diameter and a calibrated 241Am α-source with various masks and at various distances from the detectorMCNP simulations to define the effective solid angle for each case
234U (4a) From the two sides of 324U (4a and 4b) the Total Mass was estimated as 5.38+- 0.26 mg , while the nominal Total Mass was 5.46 mg
232U contamination 234U (2.5x10⁵y) 232U (69y) 232U 228Th 224Ra 212Bi 220Rn 216Po 212Po 232U contamination : 0.03 %
Contamination of the scattering chamber 4000sec 80.000sec Cleaning the contaminated parts of the chamber reduced the contamination by ~50%
237Np (28) measured in the air out of the chamber 237Np 241Am From one side of 327Np (28 ) the Mass was estimated as 6.36+- 0.26 mg , while the nominal Total Mass from both sides was 12.82 mg 241Am contamination : 0.02 %
In order to do RBS measurements the external beam system will be used to avoid further contamination of the chamber Work in progress