Download
1 / 20
210 likes | 503 Vues
Life at the edge: local adaptation and range limits for two estuarine sea slugs. Hanna Koch Dr. Patrick Krug California State University, Los Angeles. Local Adaptation. Selection for low salinity tolerance. Selection for high thermal tolerance. Migration (gene flow). Env. 1 - Los Angeles.

E N D
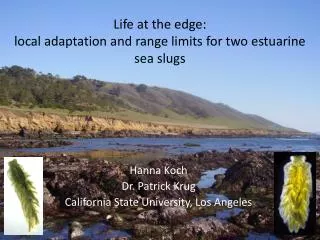
Life at the edge:local adaptation and range limits for two estuarine sea slugs Hanna Koch Dr. Patrick Krug California State University, Los Angeles
Local Adaptation Selection for low salinity tolerance Selection for high thermal tolerance Migration (gene flow) Env. 1 - Los Angeles Env. 2 – San Fran • Natural selection produces adaptation, but: • Slxn doesn’t always favor same traits in every habitat • Animals don’t always stay in one place • Adaptation results from selection on a heritable trait • Gene flow opposes adaptation
Range Limits • Represent species’ limits to adaptability • Useful for ID’ing & testing limiting factors that shape distributions/abundances of organisms • Geographic barriers • Abiotic (temperature, salinity) • Genetic Constraints (what inhibits adaptation) • Biotic Interactions (competitive exclusion)
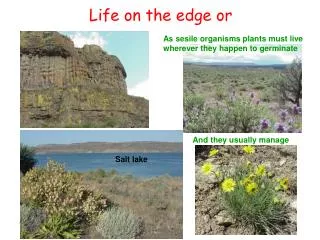
Intertidal ecosystem • Model system: • Ideal for range limit studies • Easily tracked along 1-D, narrow shoreline • North & south endpoints • Distribution spatially & temporally restricted by tides • Exposed to extreme temps & salinities • No subtidal refuge • Climate change can lead to range shifts
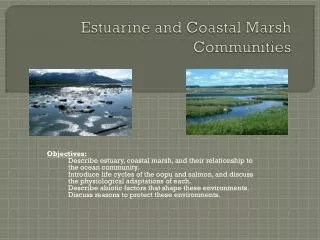
Alderia modesta - Alderia willowi Vaucheria longicaulis • Estuarine sea slugs • Live on exposed mudflats of salt marshes along North America’s Pacific coast • Live & feed on alga that grows on the mudflats
willowi, modesta Dynamic Range Boundary Bodega Bay Alderia modesta Northern sp. Tomales Bay (HI) Tomales Bay (OF) Alderia willowi Southern sp. SF Bay
range edge vs. range center A. willowi • Tomales Bay (stressful): • range edge • least freshwater input compared to surrounding bays (Bodega & SF) • Tectonically formed • Los Angeles (optimal): • range center • More stable environment than TB • Warmer temps • 4-fold less precipitation • Preferred higher salinities Tomales Bay Range edge LA Range center
Hypotheses 1. The range-edge population is more locally adapted to low salinity stress than range center 2. Local adaptation over the rainy season is more pronounced at the range edge 3. Low salinity tolerance is a genetic, heritable trait & is favored at the range edge
Methods- measuring low salinity tolerance (time to death) Vital Staining 2 ‰ SW
Results 1 (summer): local adaptation across range ANOVA: F2,57 = 10.85, p < 0.001 A. willowi B > A, p < 0.001 A B B Mean Time to Death (min) Bolinas Tomales Bay Los Angeles (Range center) (Range edge) Range edge exhibits greater local adaptation to low salinity stress, even during summer before the winter rains
Results 2: local adaptation over growing season Range Center Range Edge ANOVA: F1,38 = 244.12, p < 0.0001 A. willowi ANOVA: F1,38 = 6.0, p = 0.019 A. willowi 2 days Mean Time to Death (min) 5.4 hrs 3.7 hrs 3 hrs September ’10 December ‘10 September ’10 December ‘10 Populations become more adapted over rainy season & even more so @ range edge
Results 3: low salinity tolerance is a heritable trait A. willowi A. willowi Mean Time to Death (min) Range Center Range Edge Generation 0 Generation 1 Generation 2 Low salinity tolerance is (A) genetically based (B) favored at the range edge
Results 4:comparing low salinity tolerance between sister species ANOVA: F1,38 = 10.4, p < 0.005 ~3 days Mean Time to Death (min) ~2 days A. modesta A. willowi modesta’sability to withstand lower salinities for longer provides greater local adaptation & competitive advantage over willowi in SF
Conclusions • Gradients in salinity drive variations in local adaptation for A. willowi across its range • @ range center, LA: nat’lslxn on low S tolerance is relaxed • Slight local adaptation, only seen over rainy season • @ range edge, Tomales Bay: strong slxn on low S tolerance • Strong local adaptation, Low S tolerance conferred to offspring • A. willowi northern range limit currently fixed @ TB • Genetic constraints • In SF, the most adapted willowi still never reach same level of tolerance to very low salinity as modesta does
Overall Study Significance • If we can better understand how tolerance for the physical environment limits the geographical range of species, then we can make better predictions of potential ecosystem responses to climate change, which is critical to effective management and conservation
Thank You • The Krug Lab: Dr. Patrick Krug, Dr. Jann Vendetti, Betsy Shimer, Dominique Gordon, Matthew Garchow, Angela Llaban, Julia Vo, Diane Rico, John Martin
Climate Change • As global temperatures rise: • Changes in salinity & rainfall patterns • Worldwide range limit shifts • Previous studies suggest poleward (upper) bounds set by physiological limits; equatorial (lower) bounds set by interspecific competition
Daily exposure to 2‰ water Daily exposure to heat stress …correlated with seasonal shifts in temperature & salinity Seasonal shifts in presence / abundance… Population Dynamics in Mill Valley - SF
Abiotic Stress • Salinity gradients can determine distributions w/in estuaries • Salinity has not yet been linked to N-S range endpoints in a intertidal animal, yet is critical for estuarine taxa dist. Along coastlines w/ strong latitudinal gradient in precipitation like NE Pacific