Download
1 / 48
480 likes | 661 Vues
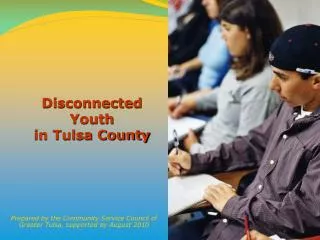
Commissioned by JumpStart Tulsa. State Of Health tulsa County. Prepared by the Community Service Council October 2011. tulsa County. Demographic Trends Economics and Employment Health Indicators Indicators. Demographics. DEMOGRAPHIC TRENDS.

E N D
Commissioned by JumpStart Tulsa State Of Health tulsaCounty Prepared by the Community Service Council October 2011
tulsaCounty • Demographic Trends • Economics and Employment • Health Indicators Indicators Demographics
Population change--migration to suburban areas of Tulsa and Oklahoma City MSA with an overall decrease in new births Age--aging population Race and ethnicity--more culturally diverse Living arrangements--transitional for family living arrangement Demographic Trends Demographics
Demographics Prepared by the Community Service Council of Greater Tulsa
Lack of health insurance • Limited access to preventative services • Living in high risk families • Living in a state with a high level of premature death Why are children at risk? Child Indicators Prepared by the Community Service Council of Greater Tulsa
Major American research project that poses the question of whether and how childhood experiences affect adult health decades later • Provides compelling evidence that: • Adverse childhood experiences are surprisingly common • ACE’s happen even in “the best of families” • ACE’s have long-term, damaging consequences • Findings reveal powerful relationships between emotional experiences as children and physical and mental health as adults The Adverse Childhood Experiences (ACE) Study Child Indicators Source: The Adverse Childhood Experiences Study website: www.acestudy.org, “About the Adverse Childhood Experiences Study.”
The Adverse Childhood Experiences (ACE) Study Pyramid Death Child Indicators Conception Mechanisms by which Adverse Childhood Experiences Influence Health and Well-being throughout the Lifespan Source: The Adverse Childhood Experiences Study website: www.acestudy.org, “About the Adverse Childhood Experiences Study.”
Adverse Childhood Experiences… …growing up in a household with: • Recurrent physical abuse • Recurrent emotional abuse • Sexual abuse • An alcohol or drug abuser • An incarcerated household member • Someone who is chronically depressed, suicidal, institutionalized or mentally ill • Mother being treated violently • One or no parents • Emotional or physical neglect Child Indicators Source: The Adverse Childhood Experiences Study website: www.acestudy.org, “What are Adverse Childhood Experieinces (ACE’s).”
…Lead to Health-Risk Behaviors… • Smoking • Overeating • Physical inactivity • Heavy alcohol use • Drug use • Promiscuity Child Indicators Source: The Adverse Childhood Experiences Study website: www.acestudy.org
…Which Cause Disease, Disability and Social Problems in Adulthood • Heart disease • Cancer • Chronic lung and liver disease • Stroke • Diabetes • Sexually transmitted diseases • Nicotine addiction • Alcoholism • Drug addiction • Obesity • Depression • Suicide • Injuries • Unintentional pregnancy Child Indicators Source: Felitti, Vincent J., “The Relationship of Adverse Childhood Experiences to Adult Health: Turning gold into lead;” CDC Media Relations, May 14, 1998, “Adult Health Problems Linked to Traumatic Childhood Experiences.”
Child Indicators Prepared by the Community Service Council of Greater Tulsa
In Tulsa County in FY 2009, there were 3,933 reports of child abuse and/or neglect accepted for investigation or assessment. 6,583 children were involved in these reports (duplicated count). 1,248 children were confirmed victims of child abuse and/or neglect. 89 were abused, 992 were neglected, 167 were victims of both abuse and neglect. Eight of every 1,000 children in Tulsa County are victims of abuse and/or neglect. In Oklahoma, the rate is 10 of every 1,000 children. Oklahoma ranks #35 in the nation in the rate of children who are victims of abuse and/or neglect. Parents make up 73.7% of all perpetrators, followed by “no relation” at 6.9%, step-parents at 5.9%, and grandparents at 3.5%. Substance abuse is a major contributing factor to child neglect. Child Abuse & Neglect Child Indicators Prepared by the Community Service Council of Greater Tulsa
Crime & Incarceration Prepared by the Community Service Council of Greater Tulsa
Parental separation or divorce 49 Incarcerated household member 76 Mentally ill household member 77 Substance abusing household member 76* Violence against mother 57 Psychological, physical & sexual abuse 12 Emotional & physical neglect 4 Overall ranking 31 Rankings: 1 = best, 77 = worst *Indicates a tie with at least one other county Adverse Childhood Experiencestulsa County Rankings Child Indicators Source: Oklahoma KIDS COUNT Factbook, 2006-2007, Oklahoma Institute for Child Advocacy
Client Outreach Case Finding Free Pregnancy Testing Planline/Family Planning BabyLine/RiskAssessment Safety Net/ Low and Moderate Risk Care Social Marketing OU CHC IHCRC Morton OSU OB/GYN OU Family Med PP THD Xavier TULSA PERINATAL HEALTH CARE SYSTEM High Risk Care Deliveries Hillcrest Southcrest OSU St. John Saint Francix Private Doctors OSU OU OB/GYN Safety Net/Post-partum & Family Planning OU CHC IHCRC Morton OSU OB/GYN OU Family Med PP THD
Best PracticesStrategies • Outcome performance measures • Community coalitions • Collaborative, public-private partnerships • Consumer/client investments • Successful outreach and recruitment • Case management/Care coordination • Strong social marketing • Risk reduction education • Access to services and care • Child care • Transportation • Translation
Responses…before birth and through age 5 years old Support systems • Free pregnancy testing • Babyline • Home visitation programs • High risk medical case management • Home-clinic case management • Early care and learning • Health information exchange System supports • Community profile • Fetal-infant mortality review • PRAMS • Tots • First grade study • Family Health Coalition/Turning Point • JumpStart Tulsa • Teen Pregnancy Prevention Coalition
State Of Health tulsa County Prepared by the Community Service Council of Greater Tulsa October 2011 …is available on our website: www.csctulsa.org