Download
1 / 28
280 likes | 370 Vues
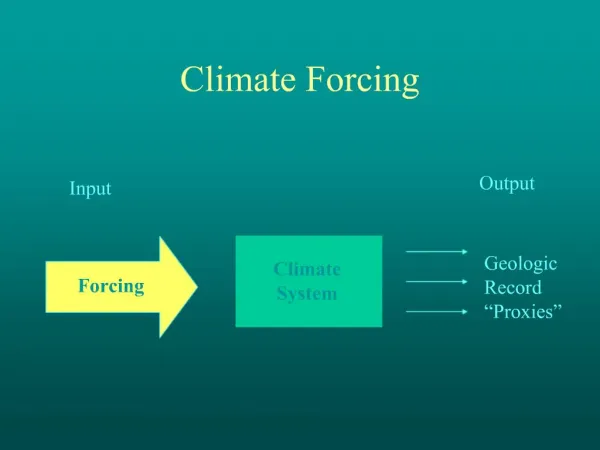
Road Map to Quantify Climate Forcing Factors on Himalayan Glaciers. Baldev R. Arora Wadia Institute of Himalayan Geology, DEHRADUN 248 001, India E-mail ID: arorabr@wihg.res.in. Climate Change: A reality.

E N D
Road Map to Quantify Climate Forcing Factors on Himalayan Glaciers Baldev R. Arora Wadia Institute of Himalayan Geology, DEHRADUN 248 001, India E-mail ID: arorabr@wihg.res.in
Climate Change: A reality • Rise of mean annual global surface temperature by 0.74±0.18oC during the last 100 years - Global Warming • Source level increase in anthropogenic emission of carbon-dioxide in atmosphere • Sea level variations • Observable changes in onset and durations of seasons, precipitation pattern, river runoff, variability in biodiversity, etc. • are considered as pointers of changing climate
Assessment of Glacier Health by Snout Monitoring 1995 1962 Recession of Dokriani glacier over the period 1962-1995 Average rate of recession = 16.5 m/yr
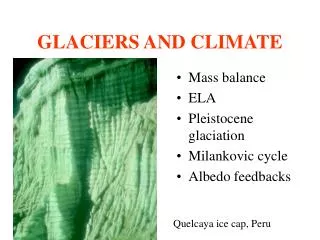
Mass-balance studies of Himalayan glaciers ●Shanker R., 1999; Dobhal et al., 1995; Dobhal et. al., 2007; Kaul et al., 1997
DOKRIANI BAMAK GLACIER -BHAGIRATHI BASIN, UTTARAKHAND Din Gad Catchment Glaciated Area – 7 km2 Catchmnet Area ~ 16 km2 Altitude > 3800 m AERIAL VIEW Glacier recession Mass balance Glacial melt water flow Glacial sediment transfer
Met Parameter and Snout Recession Trend of Dokriani Glacier- Annual Rain Fall (mm) Annual snout Retreat Standing Snow Depth (mm) Winter Snow precipitation Annual Average Temp.
Global Warming Factors ANTHROPOGRNIC- (Greenhouse Gases, aerosols, dust) NATURAL Solar forcing Orbital forcing Radiative forcing
AA AA AA Long Term Ice Age Cycles of 100 Kyr (Milankovitch Cycles) are attributed to the eccentricity of the Earth’s orbit around the Sun Changes in the Earth's orbit around the Sun (Milankovitch Cycles) are believed to be the pacemaker of the 100,000 year ice age cycle.
Correlation between Solar Irradiance and Sunspot Solar cycle during 1978-2004
Do Solar Cycles cause Global Warming? The global surface temperature, de-trended for Global warming, shows strong correlation with Total Solar Irradiance (TSI) (Source: Charles D. Camp and Ka Kit Tung, 2007) Forcing from the Sun increases global surface temperature by 0.18o C during the 11-Year Solar Cycle Volcanic eruptions: 1982, 1991 and El-nino Pear 1998
Dependence of Global Surface Temperature On 11-year Sunspot Solar Cycle
Global measurements of Solar wind pressure by Ulysses Space- craft during 1992-98 (Green Curve) and 2007-2008 (Blue Curve), Scanning respectively the minimum of solar cycles 22 and 23 Solar wind looses power: Hits 50 year low Solar –Terrestrial implications Heliosphere inflates less: Less shielding against the Cosmic Rays High energy electron (20GeV) in cosmic ray show around 20% increase around the earth Sun’s magnetic field also decreased by 30% since 1950 (Source: http:// science-nasa.gov/sceince-news/science-at-nasa/nasa/23sep_solarwind/)
Comparison of temperature and density of electrons in solar wind During solar minimum 22 (1994-95) and 23 (2007) Issautier et al., GRL 35, L19101, doi 10,1029/2008, 2008 Results No significant change in Solar wind speed : 3% Solar wind pressure has decreased largely due to decrease in temperature & density Solar wind Cooler : 13% Solar wind less dense: 20%
Global measurements of Solar wind pressure by Ulysses Space- craft during 1992-98 (Green Curve) and 2007-2008 (Blue Curve), Scanning respectively the minimum of solar cycles 22 and 23 Solar wind looses power: Hits 50 year low Solar –Terrestrial implications Heliosphere inflates less: Less shielding against the Cosmic Rays High energy electron (20GeV) in cosmic ray show around 20% increase around the earth Sun’s magnetic field also decreased by 30% since 1950 (Source: http:// science-nasa.gov/sceince-news/science-at-nasa/nasa/23sep_solarwind/)
A laboratory experiment to simulate effect of debris cover • on melt rate of glacier when subjected to: • Steady state heat flux – Increase in average temperature • Diurnally varying heat flux – Day/Night variation in solar radiation • Rainfall together with diurnal thermal forcing • Reznichenko et al., J. Glaciology, 56, 384-396,2010) The experimental arrangement for tests with diurnal cycles: melting blocks of bare and debris-covered ice exposed to identical radiation during the 12 hour ablation period (attained by two electric bulbs with short-and longwave radiation and cooling by freezer during the 12 hour night
Influence of Debris cover in steady-state (constant increase in heat flux) conditions Under the effect of fixed increase in heat-flux, i.e in the absence of diurnal variability of radiation, the primary role of debris cover is to delay the onset of steady ice surface melting; once melting rates stabilize, the debris cover has no further significant effect on rate of ablation;
Effect of Diurnal Radiation Cycle & Rainfall on Ablation Rate for debris covered ice Under cyclic diurnal radiation- a reduction in ablation rate occurs, & degree of reduction is controlled by the debris-cover thickness. The effect of rainfall on ice ablation depends both on intensity of diurnal cycle on the permeability of the debris cover: High-permeability supra-glacier - accelerated ablation Rock-avalanche debris - relatively impermeable - reduced ablation rates
Action plan to establish climate forcing factors on glacier dynamics • Establish Flagship Field Stations for multidisciplinary high quality data capture to establish inter-linkages of various forcing factors with glacier dynamics • Document glacial responses to palaeoclimatic variability through laboratory sediment records (moraine, glacial, fluvial and lacustrine), ice cores, peat logs, tree rings etc. • Supplement studies by numerical/laboratory simulation experiments to answer key questions and understand processes controlling climate forcing
Some specific key questions to be answered • Are all the Himalayan glaciers retreating? If so, at what rate? • Is the glacial retreat affected by Anorthopognic factors or are there Natural Climate Parameters? What are the forcing factors responsible for glacial dynamics in the Himalaya? • How slope and geometry of the valley control the glacier dynamics? • Is there a difference in the rates of retreat between larger and the smaller glaciers? If so, why and How much? • Does the valley orientation (direction) have any bearing on the magnitude of response (retreat)? What is the magnitude of change? • Whether the moraine cover protect the glaciers from incoming solar radiation? Can this be quantified? • Whether the Proxies like Snow line and/or Tree line fluctuations in Himalaya marker of climate variation?