*does not include dual majors.
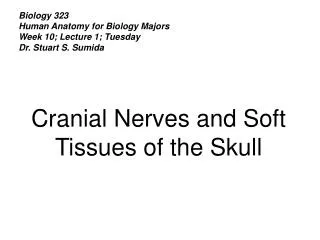
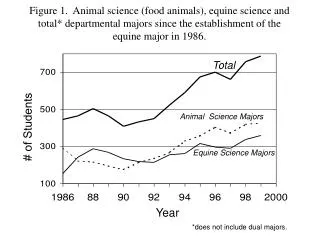
Figure 1. Animal science (food animals), equine science and total* departmental majors since the establishment of the equine major in 1986. Total. Animal Science Majors. # of Students. Equine Science Majors. Year. *does not include dual majors.

*does not include dual majors.
E N D
Presentation Transcript
Figure 1. Animal science (food animals), equine science and total* departmental majors since the establishment of the equine major in 1986. Total Animal Science Majors # of Students Equine Science Majors Year *does not include dual majors.
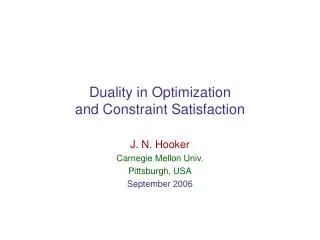
Figure 2. Departmental credit hour production and percentage of credit hours in focused equine courses. (Note: 46% of equine science departmental requirements are general animal science courses.) Total Credits Eq Focus Credits, % of Total Total RI Credits % Equine Focus Year
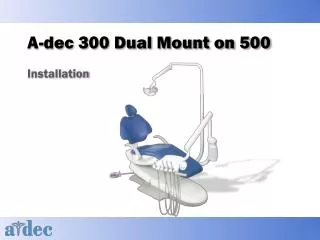
Figure 3. Teaching FTEs (full time equivalents) in the department of animal sciences and the percentage of FTEs with an equine science focus. Total FTEs Total Teaching FTEs Equine Focus FTEs, % of Total % Equine Focus Year