Download
1 / 28
280 likes | 296 Vues
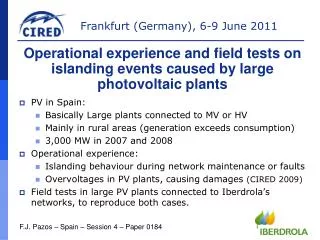
This study examines the impact of regulation, profitability, and other factors on the diffusion of PV grid-connected systems in Spain from 2004-2013. The analysis considers financial conditions, solar irradiation, system costs, and electricity prices. The study concludes that regulation, market dynamics, and economic conditions played significant roles in the diffusion of PV systems in Spain.

E N D
Regulation, profitability and diffusion of PV grid connected systems in Spain 2004-2013 Javier López Prol Promitheas conference Athens, October 2015
Content Introduction: climate change, energy and PV Spain & PV: a loveandhaterelationship Determinantsofprofitability Financial conditions Solar irradiation Costs Electricityprices (Regulation) Profitabilityanddiffusion Sensitivity analysis Conclusions
1. Introduction Renewable energies Solar: most abundant resource Not only for sustainability, but also for energy security Soºurce: EPIA and Greenpeace
1. Introduction Renewable energies Source: WBGU, 2011
1. Introduction Experience curve: historical production costs of modules and forecast Source: IEA (2014)
1. Introduction Source: REN21 (2015)
2. Spain & PV: love & hate Spain: 45% of global installed capacity in 2008 Source: ASIF (2009)
2. Spain & PV: love & hate Spain: 0% of global installed capacity in 2014 Source: REN21 (2015)
2. Spain & PV: love & hate Our hypothesis: Profitability is the main driver of diffusion. A profitability bubble created by too generous incentives in a time of declining costs, caused a diffusion bubble which bust when the incentives were removed due to the economic crises and the high policy costs
3. Determinants of profitability 3.1. Financial conditions: Typical financial conditions: 80% financed in 10 years at market interest rates (Average of the period 2004-2013 ): - Residential or small scale (SC) (R): 7,15% - Commercial-Industrial or medium scale (MC) (C-I): 5,25% - Utility orlarge scale (LC) (U):3,78% • Other assumptions: • Electricitypricesescalation rate: 2% • O&M cost: 1% of initial investment • Degradation rate: 0,8% • Lifetimeofthesystem: 25 years
3. Determinants of profitability 3.1. Solar Irradiation U R and C-I Source: PVGIS
3. Determinants of profitability 3.1. System cost Smaller installation, higher cost Source: IEA
3. Determinants of profitability Quota + degression Moratorium 3.1. Electricity prices (regulation) FIT ≤100kW ≤100kW 100kW-10MW roof≤20kW 100KW-50MW roof 20kW-2MW ground≤10MW 10-50MW Pool RDL 1/2012 RD 436/2004 RD 661/2007 RD 2818/1998 RD 1578/2008 RD 1565/2010 Source: own
4. Profitability and diffusion 4.1. Profitability Upper line: soft loans (3%) and max. subsidy (40% cost) MC installations, high FiTs MC installations, low FiTs Source: own
5. Profitability and diffusion Diffusion bubble Profitability bubble
5. Profitability and diffusion PV boom happened in a moment when the profit rate of the economy was crumbling (almost 10 percentage points in 2009 and 17 pp between 2008-2009 according to AMECO)
6. Sensitivity analysis Base case: current situation (2013) of the Utility segment without any incentive, high irradiation and optimal tilt.
7. Conclusions False myths:
7. Conclusions Regulation was not flexible enough to adapt to market dynamics (even when degression was established, costs dropped higher than FiTs). (Del Rio & Mir Artigues, 2012 and 2014) Economic crisis played a major role in the diffusion bubble, as the profit rate of the economy was falling dramatically in contrast with security provided by FiTs (capital flight from construction sector and financialization of PV investments) (Prieto & Hill, 2014) Expectations played also a main role (rush to invest before Degression system and Quotas were established and FiTs lowered) Grid parity has not been reached yet for Utility segment (2013). Profitability will be above 4% when costs decline by 30%, wholesale electricity price trebles, or if expected escalation rate of electricity prices is above 5% (a combination of the three factors is more likely)
6. Sensitivity analysis 6.1. Diffusion Between 2005-2012 FiTs were compromised to ensure a total retribution of about 46B€* at present value (3% discount) for the next 29 years** How would the diffusion process had been if the NPV of the total remuneration for PV investors was directly invested and evenly distributed during these 29 years? +44% +22% +9% • Assumptions: • 3% discount rate • Constant cost decline towards 1€/W in 2040 (solid lines); no cost decline (dashed lines). • 100% investment in large installations (green lines); or small ones (blue lines) • No economies of scale • No admin. Costs • Lyfetime of the system: 25 years -46%
Appendix: Germany: • Clear correlation profitability diffusion • Larger scale, stronger correlation and sensitivity • Not only important profitability level, but also relative change with respect to the profit rate of the economy