Developing Workflow Process Diagrams To Target Interventions
This session focuses on developing workflow process diagrams to streamline interventions in healthcare settings. Participants will learn to define workflow steps and symbols, collaborate on examples with peers, and create their own workflow diagrams to enhance their work processes. By understanding processes and systems, attendees will target improvements, allocate resources efficiently, and foster effective teamwork. Key topics include QI principles, causal analysis of patient care workflows, and practical examples to support patient adherence and successful interventions.

Developing Workflow Process Diagrams To Target Interventions
E N D
Presentation Transcript
Developing Workflow Process Diagrams ToTarget Interventions Moderator: Mindy Golatt, RN, MPH, Public Health Analyst, HRSA/HAB Presenters: Paul Cassidy, Program Director, GNBCHC Erika Harding, Health Administrator, CCHC Facilitator: Nanette Brey Magnani, NQC/HIVQUAL QM Consultant
Learning Outcomes Participants will be able to: • Define the steps and symbols used in workflow process diagrams, • Engage in discussion with grantees about their examples, and • Begin to develop a workflow process diagram of their own work processes.
Agenda QI Principles and Framework Workflow Diagrams The Basics Examples Try it out! Post AGM Discuss and Revise with your Team.
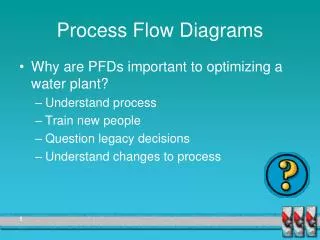
Why Look at Processes? Fundamental Concept of Improvement: “Every system is perfectly designed to achieve exactly the results it achieves” Principles of Improvement: • Understanding work in terms of processes and systems • Developing solutions by teams of providers and patients • Focusing on patient needs • Testing and measuring effects of changes
Review: QI Principle Most problems are found in processes not in people.
Understanding Work in Terms ofProcesses and Systems Benefits • Clearer understanding of the overall system and processes • Target processes that need improvement • Efficient allocation of staff and resources • Effective use of team’s input and creative problem solving • Better understanding of each other’s roles • Reduction in waste and time
What are your initial thoughts about this improvement system?
What are your initial thoughts about this improvement system?
When do you develop your workflow diagram? QI Project Steps Step 1: Review, Collect and Analyze Baseline Data Step 2: Develop a Project Team Work Plan Step 3: Investigate the Process/Problem Step 4. Plan and Test Changes – PDSA Cycles Step 5: Evaluate Results with Key Stakeholders Step 6: Systematize Change
QI Principle Most problems are found in processes not in people. • A system is made up of processes • Processes comprise steps
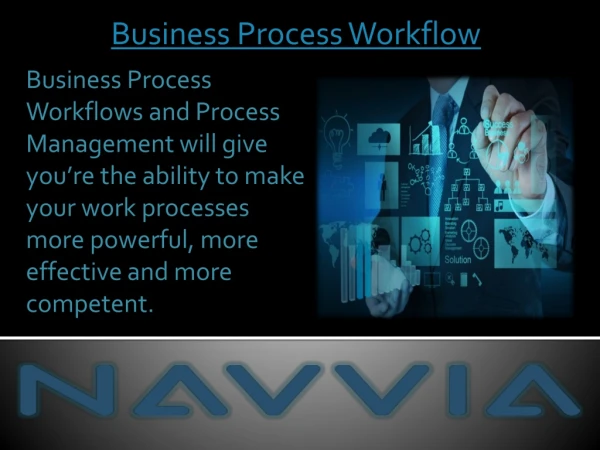
Workflow Diagram Definition A workflow diagram or flow chart is a picture of the steps of a process to: • Understand the process • Identify potential problem steps and reasons • Outline the ideal process steps • Enable communications with others
Creating a Process Diagram • Agree on use and level of detail • Define starting and ending points • Document each step • Follow each branch to the end • Review the chart . Flowcharts
Testing and Measuring a Workflow Process • Identify key problem steps. • Write key causes to each identified problem • Select interventions that address key cause. • Then test and measure new process. • Repeat as necessary. • Support new process – e.g. communication, new procedure guidelines.
Most Commonly Used Flowchart Symbols Activity/step Connecting lines Begin/ Terminator Decision Flowcharts
Grantee Examples • VL Suppression • Paul Cassidy – Greater New Bedford CHC, New • Bedford, MA • Gap in Care and Patient Transition to a different clinic • Erika Harding – Christian CHC, Chicago, IL
Performance Measure for VL Suppression Percentage of HIV patients, regardless of age, with a viral load less than 200 copies/ml at last viral load test during the measurement year. Measurement year 2011
Baseline Data Number of Patients = 320 Suppressed (Blue)= 236 Not Suppressed (Red)=84 Suppression Rate=73%
Improvement Goal To increase patients’ viral load suppression rate from 73% to 85% in six months.
Causal Analysis • Problem Steps with Workflow processes on two levels: • Patient Level • Insufficient time for adherence education for patients not suppressed
Causal Analysis cont’d • Problem Steps with Workflow processes on two levels: • Program Level • Weekly (3x/month) multi disciplinary team meetings for patient review had stopped meeting for 6 months due to construction; thus a loss of focus on non suppressed patients • Minimal input of multidisciplinary team members ideas into tailored care plans for each non suppressed patient • No feedback loop for reporting results of the interventions back to the team.
GNBCHC Workflow Process for Established Patients PATIENT REGISTERS Review Meds, barriers to adherence, based on barriers, pre-pack meds, deliver to house, review meds and fill pill box MA TAKES VITALS Determine next steps with patient ** PHYSICIAN EXAMINES PATIENT, REVIEWS RESULTS AND REGIMEN >200 <200 Multi-Disciplinary Team Review RN Adherence Visit Give lab orders, patient to Lab Order Blood work for next three month review Lab Blood Draw Schedule next visit Lab Results sent to Physician Concern with Results Lab Results Sent to RN Lab Results Sent to Data Entry. Blood work electronically entered into EHR Call patient and make earlier visit than previously scheduled Y N No further Follow-up
GNBCHC WEEKLY MULTI DISCIPLINARY MTGS. Prepare Reports Identifying Patients Not Suppressed. RE- START WEEKLY MTGS-3/MONTH • REVIEW PATIENTS • TAKE NOTES • DEVELOP CARE PLAN TEMPLATE • DEVELOP PATIENT SPECIFIC CARE PLANS • TEAM MAKES RECOMMENDATIONS • ASSIGNED STAFF PRESENT PLAN TO PATIENT FOR PATIENT INPUT • FOLLOW –UP ON RECCOMENDATIONS • INTERVENTION IS INDIVIDUALIZED SOCIAL WORK INTERVENTION • FOLLOW-UP ON PLAN PEER NAVIGATOR INTERVENTION • FOLLOW –UP ON PLAN RN INTERVENTION • DEVELOP AND IMPLEMENT CARE PLAN • FOLLOW -UP *** BARRIERS TO VIRAL LOAD SUPRESSION • SUBSTANCE ABUSE • HOMELESSNESS • NOT ATTENDING APPOINTMENTS • MENTAL HEALTH ISSUES • REFUSE MEDICATIONS SCHEDULED TEAM MEETINGS-REVIEW RESULTS OF INTERVENTIONS # OF PATIENTS WITH VL >200 REVIEWED # WITH TARGETED CARE PLANS PATIENT RESPONSE TO INTERVENTION DATA ENTRY
GNBCHC – Measurement • Data Update
Christian CHC: Improvement Goals To reduce the gap in care rate from 13% to 5%. (number of patients with a medical visit in the last 6 months of the measurement year) To ensure 170 patients or 69% of our HIV+ population at the Monterey Clinic are successfully transitioned to the Halsted Clinic.
Quality Improvement Team GROUP PHOTO HERE
Transition Care from Monterey to Halsted CCHC Patients notified Instructed to make appt at different site Patient Makes Appt.? Requires Follow-up No Yes Receives reminder call from PHA – 1 day prior Appt Kept.? Patient Registers Scheduler Repeat call from PHA No Yes
Patient Follow-up Data specialist initiates Patient Tracking Tool Import list of patients from CAREWare who’s last visit >45 days Patient Has a Scheduled appt? No Yes Refer names to Patient Health Advocate for follow-up Note appt date in Patient Tracking Tool No Yes Active, Continuing? Refer to Scheduler for appointment Document status in list and chart PHA meets monthly with QI Team for patients’ status update
Measurement Data Start PSDA Cycle 3 Ends Cycle 1 Ends Cycle 2 Ends
Task: Draw a Workflow Process Diagram • Select a process to improve. It can be just a few steps. • Agree on use and level of detail. • Define starting and ending points • Document each step. Use paper provided. • Follow each branch to the end • Review the chart. Flowcharts
Large Group DeBrief What improvement processes did you choose? Who will share your diagram? What were some of your challenges? What do you think are the benefits? What can you do post AGM? Flowcharts
REMINDER This is a TEAM effort! Flowcharts
Contact Information Paul Cassidy, Program Coordinator, Greater New Bedford Community Health Center, New Bedford, MA pcassidy@gnbchc.org Erika Harding, MPH, Health Administrator, Christian Community Health Center, Chicago erika.harding@cchc-rchm.org Flowcharts
Contact Information Mindy Golatt, RN, MPH, Public Health Analyst, HRSA/HAB, Project Officer/Chicago, mgolatt@hrsa.gov Nanette Brey Magnani, EdD, Quality Management Consultant, NQC/HIVQUAL, breymagnan@aol.com Flowcharts

![Target Process: DMJ [DRAFT]](https://cdn1.slideserve.com/3284350/target-process-dmj-draft-dt.jpg)


![Target Process: DMJ [DRAFT]](https://cdn5.slideserve.com/9498545/target-process-dmj-draft-dt.jpg)