Download
1 / 1
10 likes | 124 Vues
Figure 1. Mean daily trap of E. servus across 6 pheromone traps in Virginia. Blacklight trap. Rigid beat sheet sampling in soybean. Figure 3. 10-year average of weekly A. hilare catch at blacklight trap at Painter, VA. Table 1. Number of stink bugs captured in cotton, 2005 season.

E N D
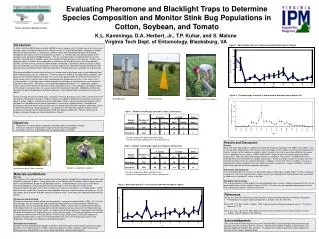
Figure 1. Mean daily trap of E. servus across 6 pheromone traps in Virginia Blacklight trap Rigid beat sheet sampling in soybean Figure 3. 10-year average of weekly A. hilare catch at blacklight trap at Painter, VA Table 1. Number of stink bugs captured in cotton, 2005 season. Sample method Number of stops E. servus A. hilare Other Adult Nymph Adult Nymph Adult Sweep net sampling in soybean Acrosternum hilare, Green stink bug Beat sheet 5201 16 7 14 2 1 Sweep net 3202 4 0 10 0 2 Figure 2. Mean nightly catch of A. hilare across 8 blacklight traps in Virginia 1 Six-foot sample with rigid or cloth beat sheet. 2 Twenty-five sweep sample with 15-inch diameter net. Table 2. Number of stink bugs captured in soybean, 2005 season. Sample method Number of stops E. servus A. hilare Other Adult Nymph Adult Nymph Adult Beat sheet 3741 45 12 18 7 6 Sweep net 5942 80 59 113 96 14 1 Six-foot sample with rigid or cloth beat sheet. 2 Twenty-five sweep sample with 15-inch diameter net. Evaluating Pheromone and Blacklight Traps to Determine Species Composition and Monitor Stink Bug Populations in Cotton, Soybean, and Tomato Introduction In 2003, more than 85,000 acres of cotton, 480,000 acres of soybean, and 1.8 million pounds of fresh-market tomatoes were cultivated in Virginia with a value of over 30, 81, and 60 million dollars, respectively (Virginia Agricultural Statistics 2004). In recent years, cotton varieties with the Bollgard (Bt) gene have gained acceptance with growers and it is estimated that up to 87% (J. Faircloth, personal communication) of the acreage is now planted with Bollgard varieties. This has resulted in fewer insecticide treatments for corn earworm, Helicoverpa zea (Boddie), which has enabled stink bug pest pressure to increase. In 2004, stink bug populations in soybean were responsible for numerous calls during the season by concerned local growers, and after harvest, numerous reports of poor seed quality. Furthermore, Nault and Speese (2002) recently conducted a survey of tomato pests in eastern Virginia from 1998-2000 and documented that stink bug injury was an important factor reducing marketable fruit yield of tomatoes, especially in the spring crop. Stink bugs are difficult to detect because they have a wide range of host crops and can move between them quickly because they are such strong fliers. For these reasons and due to a multiple-species complex, stink bugs can be extremely difficult to manage. As a result, many growers often do not detect the presence of these insects until it is too late and serious crop damage has already occurred, or as is the case in fresh-market tomatoes, use multiple sprays of broad-spectrum insecticides as a preventative measure to protect fruit against these pests. Stink bugs usually attack developing fruiting forms—i.e., cotton bolls, soybean seeds, and fruit of the tomato, but they can feed on other plant tissue. Direct damage is caused by insertion of the stylets to suck plant fluids. As a result, yield and fruit quality are reduced. Additionally, feeding sites provide entry points for pathogenic and decay organisms. Most crop damage is caused by late instars and adults. Green stink bug, Acrosternum hilare (Say), and brown stink bug, Euschistus servus (Say), are two of the most commonly encountered stink bugs in Virginia. However, the species composition and incidence of this pest group in cotton, soybean, and tomato is poorly understood. Field surveys using sweep net and beat sheet methods can help determine the species populations in the various cropping systems. Blacklight and pheromone traps have been used in previous years to monitor activity of other crop pests and may be useful in determining stink bug species populations. Our goal was to evaluate these capture methods for their usefulness in monitoring stink bugs and determining their species composition. Results will be used to improve stink bug management recommendations in Virginia. Pheromone trap • Objectives • To determine stink bug species composition attacking cotton and soybean in Virginia. • To evaluate usefulness of pheromone traps for monitoring stink bug species. • To evaluate usefulness of blacklight traps for monitoring green stink bug. K.L. Kamminga, D.A. Herbert, Jr., T.P. Kuhar, and S. Malone Virginia Tech Dept. of Entomology, Blacksburg, VA Results and Discussion Surveys More stink bugs were caught in soybean than cotton for all species recorded in the 2005 survey (Tables 1 and 2). Bundy et al. (2000) found similar results in these two crops and it has been shown that stink bugs prefer to feed on members of the Fabacea, or legume, family. In cotton, beat sheets were more effective than sweep nets in sampling E. servus (mean = 0.0442 and 0.0125 E. servus per beat sheet and sweep net sample, respectively). Both techniques were equally effective in sampling A. hilare (mean = 0.0308 and 0.0313 A. hilare per beat sheet and sweep net sample, respectively). Contrary to cotton, sweep net samples were more effective than beat sheets for sampling stink bugs in soybean. A mean of 0.1524 vs. 0.2340 E. servus were captured per sample using beat sheet and sweep net samples, respectively. Likewise, 0.0668 vs. 0.3519 A. hilare were captured using these respective techniques. Pheromone trap monitoring The mean daily catch of E. servus in six pheromone traps in Virginia was variable (Figure 1) with a small peak in early July. Due to the low collection numbers and the high standard error, the pheromone traps may not be a viable means to monitor E. servus in the field. Blacklight trap monitoring The mid-June peak in A hilare capture from eight blacklight traps in eastern Virginia corresponds to the 14-year peak captures from Painter, Virginia (Figures 2 and 3). This peak may correspond with generation time and may indicate when adult A. hilare are most active. Materials and Methods Surveys The purpose of this experiment was to determine stink bug species composition and abundance in cotton and soybean in southeast Virginia. Twenty cotton fields in nine counties and 21 soybean fields in eleven counties were surveyed biweekly during the 2005 growing seasons. Sampling began in early July once the plants were large enough to sample and continued until late August. A 15-inch diameter sweep net (25 sweeps/sample) and a beat sheet (6 row-ft/sample) were used to survey fields in a Z-shaped pattern. A cloth beat sheet was used in 36-in row centers and a rigid beat sheet was used for narrower row spacings. Five to 20 samples were taken per field (both sweep net and beat sheet). Stink bugs were collected and identified to species. Pheromone trap monitoring Pheromone traps were used to monitor stink bug species in cotton and soybean fields in 2005. Six 1.2-m tall pyramid traps were constructed from two interlocking triangular panels of yellow coroplast (AIN Plastics, Virginia Beach, VA) as described by Mizelle and Tedders (1996). A Euschistus lure (Advanced Pheromone Technologies INC) with the active ingredient methyl 2,4 decadienoate was attached to the Rubbermaid trap top and replaced every two to three weeks. A fumigant strip containing dichlorvos (Vaportape II strip, BioQuip Products) was placed in the trap to prevent any insects from escaping. The traps were placed in five counties in southeast Virginia (Greensville, King William, Prince George, Southampton, and Suffolk) adjacent to soybean and cotton fields. Traps were monitored weekly from early June through crop harvest in late September. Stink bugs were collected and identified to species. Blacklight trap monitoring Standard 15-watt blacklight traps (Gempler’s, Madison, WI) were used to monitor stink bug species in eight locations in five Virginia counties in 2005. Traps were adjacent to cotton, soybean, and/or tomato fields. Stink bugs were collected from early June through September and identified to species. References Bundy, C.S. and R.M. McPherson. 2000. Dynamics and seasonal abundance of stink bugs (Heteroptera: Pentatomidae) in a cotton-soybean ecosystem. J. of Econ. Ento. 93: 697-706. Mizell, R.F., H.C. Ellis and W.L. Tedders. 1996. Traps to monitor stink bugs and pecan weevils. The Pecan Grower 8: 17-20. Nault, B.A. and J. Speese III. 2002. Major insect pests and economics of fresh-market tomato in eastern Virginia. Crop Protection 21(5): 359-366. Acknowledgments The authors wish to thank the personnel at the Tidewater AREC and the blacklight and pheromone trap operators for their assistance with this research. Special thanks to Mike Arrington, Carter Goerger, and Amanda Koppel for help with data collection. This project was funded in part by the Virginia Agricultural Council and the Virginia Soybean Board.