Vegetation Cover, Organic Matter, and PCB Concentration Along a Transect
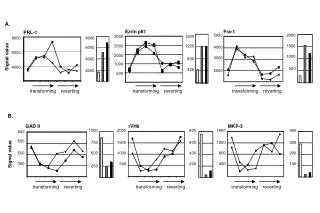
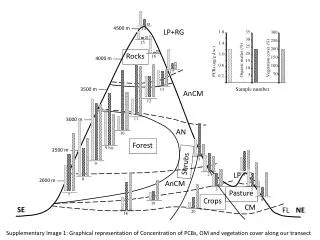
This study presents a comprehensive analysis of vegetation cover percentage, organic matter content, and concentrations of PCBs in ng/g d.w. across different land uses, including forests, shrubs, pastures, and crops. Data points were collected at various elevations from 2000m to 4500m to explore how environmental factors influence these elements. The graphical representation illustrates the correlation between PCB levels, organic matter, and vegetation cover, providing insights into ecological health and pollution impacts.

Vegetation Cover, Organic Matter, and PCB Concentration Along a Transect
E N D
Presentation Transcript
14 15 13 12 16 11 1 20 3 4 5 18 19 2 17 1.8 35 300 30 250 1.4 25 200 20 1.0 Vegetation cover (%) 150 Organic matter (%) PCBs (ng/g d.w.) 15 0.6 100 10 50 5 0.2 7 6 8 9 9 bis 10 Sample number LP+RG 4000 m 2500 m 4500 m 3500 m 2000 m 3000 m Rocks AnCM AN Forest Shrubs LP AnCM Pasture Crops CM SE FL NE Supplementary Image 1: Graphical representation of Concentration of PCBs, OM and vegetation cover along our transect