Download
1 / 35
360 likes | 509 Vues
Chapter 10 – Lecture 10. Internal Validity – Control through Experimental Design. Test the effects of IV on DV Protects against threats to internal validity. Causation. Experimental Design. Highest Constraint Comparisons btw grps Random sampling Random assignment. Infer Causality.

E N D
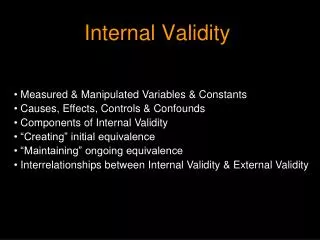
Chapter 10 – Lecture 10 Internal Validity – Control through Experimental Design • Test the effects of IV on DV • Protects against threats to internal validity Causation
Experimental Design • Highest Constraint • Comparisons btw grps • Random sampling • Random assignment Infer Causality
Experimental Design (5 characteristics) • One or more hypothesis • Includes at least 2 “levels” of IV • Random assignment • Procedures for testing hypothesis • Controls for major threats to internal validity
Experimental Design • Develop the problem statement • Define IV & DV • Develop research hypothesis • Identify a population of interest • Random sampling & Random assignment • Specify procedures (methods) • Anticipate threats to validity • Create controls • Specify Statistical tests • Ethical considerations Clear Experimental Design…
Experimental Design 2 sources of variance • between groups variance (systematic) no drug drug 2. Within groups variance (nonsystematic) (error variance) Remember… Sampling error Significant differences…variability btw means is larger than expected on the basis of sampling error alone (due to chance alone)
Need it! Without it… No go Variance VARIANCE “Partitioning of the variance” Between Group Within Group Experimental Variance (Due to your treatment) + Extraneous Variance (confounds etc.) Error Variance (not due to treatment – chance) Subs CON TX
Variance: Important for the statistical analysis between groups variance Within groups variance F = Systematic effects + error variance error variance F = F = 1.00 No differences btw groups
Variance Your experiment should be designed to • Maximize experimental variance • Control extraneous variance • Minimize error variance
Maximize “Experimental” Variance • At least 2 levels of IV (IVs really vary?) • Manipulation check: make sure the levels (exp. conditions) differ each other Ex: anxiety levels (low anxiety/hi anxiety) performance on math task anxiety scale
Control “Extraneous” Variance • Ex. & Con grps are similar to begin with • Within subjects design (carryover effects??) • If need be, limit population of interest (o vs o ) • Make the extraneous variable an IV (age, sex, socioeconomic) = factorial design M F Lo Anxiety M-low F-low Factorial design (2 IV’s) YOUR Proposals Hi Anxiety M-hi F-hi
Control through Design – Don’ts • Ex Post Facto • Single-group, posttest only • Single-group pretest-posttest • Pretest-Posttest natural control group 1. Ex Post Facto – “after the fact” Group A Naturally Occurring Event Measurement No manipulation
Control through Design – Don’ts Single group posttest only Group A TX Posttest Single group Pretest-posttest Pretest Group A TX Posttest Compare
Control through Design – Don’ts Pretest-Posttest Naturalistic Control Group Group A Pretest TX Posttest Group B Pretest no TX Posttest Compare Natural Occurring
Control through Design – Do’s – Experimental Design • Manipulate IV • Control Group • Randomization 4 Basic Designs Testing One IV 1. Randomized Posttest only, Control Group 2. Randomized Pretest-Posttest, Control Group 3. Multilevel Completely Randomized Between Groups 4. Solomon’s Four- Group
Randomized Posttest Only – Control Group (most basic experimental design) R Group A TX Posttest (Ex) R Group B no TX Posttest (Con) Compare
Randomized, Pretest-Posttest, Control Group Design R Group A Pretest TX Posttest (Ex) R Group B Pretest no TX Posttest (Con) Compare
Multilevel, Completely Randomized Between Subjects Design (more than 2 levels of IV) R Group A Pretest TX1 Posttest R Group B Pretest TX 2 Posttest R Group C Pretest TX3 Posttest R Group D Pretest TX4 Posttest Compare
Solomon’s Four Group Design (extension Multilevel Btw Subs) R Group A Pretest TX Posttest R Group B Pretest ---- Posttest R Group C -------- TX Posttest R Group D -------- ---- Posttest Compare Powerful Design!
What stats do you use to analyze experimental designs? Depends the level of measurement Test difference between groups Nominal data chi square (frequency/categorical) Ordered data Mann-Whitney U test Interval or ratio t-test / ANOVA (F test)
t-Test Compare 2 groups Independent Samples (between Subs) One sample (Within) Evaluate differences bwt two conditions in a single groups Evaluate differences bwt 2 independent groups
Assumptions to use t-Test • The test variable (DV) is normally distributed in each of the 2 groups • The variances of the normally distributed test variable are equal – Homogeniety of Variance 3. Random assignment to groups
t-distribution Represents the distribution of t that would be obtained if a value of t were calculated for each sample mean for all possible random samples of a given size from some population
Degrees of freedom (df) When we use samples we approximate means & SD to represent the true population Sample variability (SS = squared deviations) tends to underestimate population variability Restriction is placed = making up for this mathematically by using n-1 in denominator
S2 = variance ss (sum of squares) df (degrees of freedom) (x - )2 n-1 x Degrees of freedom (df): n-1 The number of values (scores) that are free to vary given mathematical restrictions on a sample of observed values used to estimate some unknown population = price we pay for sampling
Degrees of freedom (df): n-1 Number of scores free to vary Data Set you know the mean (use mean to compute variance) n=2 with a mean of 6 X 8 ? 6 In order to get a mean of 6 with an n of 2…need a sum of 12…second score must be 4… second score is restricted by sample mean (this score is not free to vary) =x
Analysis of Variance (ANOVA) Two or more groups ….can use on two groups… t2 = F Variance is calculated more than once because of varying levels (combo of differences) Several Sources of Variance SS – between SS – Within SS – Total Sum of Squares: sum of squared deviations from the mean Partitioning the variance
Assumptions to use ANOVA • The test variable (DV) is normally distributed • The variances of the normally distributed test variable is equal – Homogeniety of Variance 3. Random assignment to groups
between groups variance Within groups variance F = Systematic effects + error variance error variance F = F = 1.00 No differences btw groups F = 21.50 22 times as much variance between the groups than we would expect by chance
After Omnibus F… Planned comparisons & Post Hoc tests A Priori (spss: contrast) A Posteriori part of your hypothesis…before data are collected…prediction is made Not quite sure where differences will occur
Why not just do t-tests! 2 types of errors that you must consider when doing Post Hoc Analysis Alpha • Per-comparison error (PC) • Family wise error (FW) Inflate Alpha!!!!
FW = c(a) c = # of comparisons made a = your PC Ex: IV ( 5 conditions) 1 vs 2 1 vs 3 1 vs 4 1 vs 5 2 vs 3 2 vs 4 2 vs 5 • FW = c(a) 3 vs 4 3 vs 5 4 vs 5 10 (0.05) = .50