Download
1 / 37
380 likes | 732 Vues
Benchmarking and the Kyoto Protocol. Daan van Zanten. Agenda. Kyoto Protocol – History Benchmarking – Methodology and Process Covenant Benchmarking Energy-efficiency Kyoto Protocol – Current Status and Progress EU Emission Trading Scheme Future Developments.

E N D
Benchmarking and theKyoto Protocol Daan van Zanten
Agenda • Kyoto Protocol – History • Benchmarking – Methodology and Process • Covenant Benchmarking Energy-efficiency • Kyoto Protocol – Current Status and Progress • EU Emission Trading Scheme • Future Developments
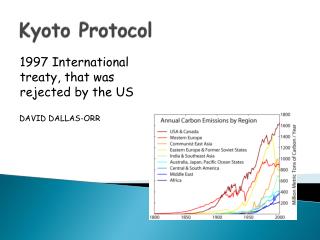
History of the Kyoto Protocol • In 1992 at Rio de Janeiro, the United Nations Framework Convention on Climate Change (UNFCC) was signed developed countries to stabilize greenhouse gas (GHG-) emissions at 1990 levels by 2000. Further meetings so-called “Conference(s) of Parties” or COP’s. • At COP-3 in 1997 the Kyoto Protocol was adopted legally binding limits on GHG-emissions in industrial (Annex 1) countries + use of market-based implementation mechanisms. • Industrial countries to reduce emissions of GHG’s (i.e CO2, methane, nitrous oxide, hydrofluorocarbons, perfluorocarbons and sulphurhexafluoride) on average by 5.2% below 1990 levels during first ‘commitment period’ from 2008 – 2012.
The Kyoto Protocol and the EU • EU (15 pre-accession Member States) committed to reducing GHG-emissions by 8% compared to 1990 levels during theperiod from 2008-2012. • Individual emissions targets (“EU burden sharing”) for each Member State: for Netherlands the target is a 6% reduction compared to 1990 level. • Use to be made of three market-based “flexible mechanisms”- Emissions trading- Joint Implementation (JI)- Clean Develop Mechanism (CDM) • In Netherlands in 1999 the Covenant Benchmarking Energy-efficiency was signed as a tool towards achieving the Kyoto target by “world leader” operation of the energy-intensive industry.
Agenda • Kyoto Protocol – History and Implementation • Benchmarking – Methodology/Process • Covenant Benchmarking Energy-efficiency • Kyoto Protocol – Current Status and Progress • EU Emission Trading Scheme • Future Developments
Benchmarking definition • There are numerous definitions of benchmarking, but essentially it involves learning, sharing information and adopting best practices to bring about step changes in performance. So, at its simplest, benchmarking means:“Improving ourselves by learning from others". • Benchmarking is a structured, outward looking (“out-of-the-box”), practical and action-oriented process. • Since the 1990’s benchmarking is widely used in the global manufacturing industry (e.g. refineries, petrochemicals, steel).
4. Benchmarking maintains stimulus for continuous improvement 2. Benchmarking helps to learn "Best Practices" “Best-in-class”(Benchmark) 3. Benchmarking helps to measure success in closing the gap GAP 1. Benchmarking identifies opportunities for improvement Benchmarking in Practice Performance Own Performance Time
Benchmarking Methodology Benchmarking process - structured process Data Collection Recommen-dations Monitoring & Review Analysing Planning Plan – Collect – Analyze – Adapt & Act30% 50% 20% depends on scope
Benchmarking is Not the Sameas Benchmarks • Benchmarks are performance measures: How many? How quickly? How high? How low? • Benchmarking is action—discovering the specific practices responsible for high performance, understanding how these practices work, and adapting and applying them to your organization or situation. • Benchmarks are facts; benchmarking enables real improvement.
Agenda • Kyoto Protocol – History and Implementation • Benchmarking – Methodology and Process • Covenant Benchmarking Energy-efficiency • Kyoto Protocol – Current Status and Progress • EU Emission Trading Scheme • Future Developments
Benchmarking CovenantHistory • 1989-2000: ‘MJA’ Covenant for energy conservation • Multi-year agreement between government & industry • Target: 20% improvement in energy efficiency for the sector • Achieved by Chemical Industry: >25% • Major contributions: CHP (Co-generation of Heat and Power), good housekeeping, energy management. • 1997: Kyoto Protocol– Under EU ‘burden sharing’ 6% reduction in the Dutch GHG- emissions in the period 2008-2012 based on 1990 level. • 1999: Energy Efficiency Benchmarking Covenant(http://www.benchmarking-energie.nl)
Benchmarking CovenantWhat are the main elements of the Covenant ? • Covenant between the Government, the Competent Authorities (“Bevoegd Gezag”) and the energy-intensive (> 0.5 PJ/a) industry. • The industry undertakes to achieve ‘world-top’ energy-efficiency performance and the Dutch government will not impose supplementary national policy governing CO2-emission reduction (i.e energy tax, ceiling on CO2-emissions). • Benchmarking (and best practice studies / energy audits) versus the ‘world-top’ (10% best) process-installations in the world. • Undertaking from the industry to be among the world leaders by 2012 with intermediate targets for 2005 / 2008.
Benchmarking CovenantSignatories/participants/parties Ministry of Economic Affairs Ministry ofHousing & Environment Inter-ProvincialConsultative Forum* Confederation Netherlands Industry & Employers SectoralOrgani-sations Companies Signatories to the Covenant Benchmarking Commission Verification Bureau VBE (Independent authority) * Competent Authorities(‘Bevoegd Gezag / Vergunningverleners’) Consultants(Expert third parties)
Benchmarking Covenant Benchmarking ‘at large’ • Ca. 100 industrial and electricity generation companies withsome 230 sites with a total energy consumption of about 1100 PJ/a have joined the Benchmarking Covenant. • The Best International Standard (‘world-top’) energy-efficiencies for comparable processes to those used in the Dutch process installations were established in ca. 40 Benchmarking (BM) studies as well as in ca.100 Best Practice (BP) studies andin ca. 50 Energy Audits • These studies were carried out by expert third parties (consultants, some 50 in total) and were verified by theVBE according to the criteria set out in the Covenant
Benchmarking Covenant Process Steps Prepare andvalidate theEnergy Efficiency Plan (EEP) Identify world leader Establish gap toworld leader Monitoring andreporting 1 2 3 Preparation by Company Validation by Verification Bureau Advice Verification Bureau to Competent Authority Company Verification Bureau BenchmarkingCommission(Every year) Identification and establishing by Consultant Verification by Verification Bureau(Every four years)
Benchmarking Covenant Best International Standard Establishing the Best International Standard (‘world-top’)for the energy-efficiency (specific energy consumption) of a process installation (current & over the coming years up 2012): 1.Benchmark - Decile method - Region method 2. Best Practice 3. Energy Audit Order of application For process installations getting heat from a CHP-installation account is taken of the energy savings associated therewith.
Benchmarking CovenantBest International Standard – Decile BM Benchmark according to the decile (best 10%) method Spec. EnergyCons., GJ/ton 17,2 Number of process installations(outside the Netherlands)
Benchmarking CovenantEnergy use of participating industrial companies by sector* Petroleum refining Chemicals 54,8% 17,1% Glass, ceramics, cement Paper industry 3,0% 4,3% Beer Iron and steel- & non-ferrous metal industry 0,7% Otherindustry 16,1% Electronics & Components FoodIndustry 0,4% 2,5% 1,2% * Interim report 2002
Benchmarking CovenantResults and follow-up • Benchmarking of the energy-efficiency of Dutch process installations has proceeded successfully on average the Dutch installations were among the ‘world leaders’. A contributing factor was the high penetration of CHP in Netherlands. • All companies prepared Energy Efficiency Plans (EEP’s) describing their gap (+ or -) with the ‘Best International Standard’ and indicating the measures (as necessary) they would take how and when (‘AFARA’) to bridge the gap. • The energy savings of the announced/under study measuresby industry and electricity generating installations amount toca. 100 PJ/a ( ~ 6 million tons/a avoided CO2-emission)in 2012 compared to 1999.
Benchmarking CovenantYearly reporting of the planned and the achieved energy savings * 2003 data
Agenda • Kyoto Protocol – History and Implementation • Benchmarking – Methodology and Process • Covenant Benchmarking Energy-efficiency • Kyoto Protocol – Current Status and Progress • EU Emission Trading Scheme • Future developments
Current status of the Kyoto Protocol • The Kyoto Protocol came into force on 16th February 2005 following the accession of Russia which brought the GHG-emissions of the industrial (Annex I) Parties to the UNFCC which have ratified the Protocol, above 55% of the 1990 emissions. • Major other industrial countries which have ratified are Canada and Japan. The US and Australia have not ratified. China, India and Brazil are among the other countries which have ratified the Protocol but as non-Annex-1 countries they do not have obligations to reduce their GHG-emissions. • COP-10 has been held in December 2004 in Buenos-Aires. • The EU ETS (European ‘Cap and Trade’ Emissions trading scheme, initially for CO2) started on 1/1/2005 for the first period 2005 – 2007.
Kyoto Protocol targets in EU‘Burden sharing’ GHG-emission targets
Kyoto Protocol progress in EU - IActual and projected GHG-emissions
Kyoto Protocol progressDevelopment GHG/CO2-emissions worldwide % of World GHG 1990 - 2000 emissions in 2000 CO2 Change United States 20,5 +18China 15,0 +39 European Union (25) 14,0 -3 Russia 5,5 -22India 5,5 +64Japan 4,0 +12Brazil 2,5 +53Canada 2,0 +22Australia 1,5 +26
Agenda • Kyoto Protocol – History and Implementation • Benchmarking – Methodology and Process • Covenant Benchmarking Energy-efficiency • Kyoto Protocol – Current Status and Progress • EU Emission Trading Scheme • Future Developments
EU Emission Trading SchemeNational Allocation Plans (NAP’s) • Via National Allocation Plans (NAPs) each of the 25 Member States have set limits (caps) on the CO2-emissions from the energy-intensive installations by issuing allowances as to how much CO2 these installations are allowed to emit. • The scheme is mandatory for the ca. 12.000 EU ETS installations (Energy Activities, Production and Processing of Ferrous Materials, Mineral Industry and Paper & Pulp). • The NAP’s have been assessed by the EU on 11 criteria which include amongst others ‘level playing field’, technological potential’, ‘clean technology’, ‘early action’ and ‘new entrants’.
EU Emission Trading SchemeDutch National Allocation Plan • For the allocation of the CO2-emission allowances in the Dutch NAP (for the first period, 2005 to 2007) the energy-efficiency performance of installations as established under the Covenant Benchmarking (and the MJA2 for smaller installations) have been taken into account (reward for early action). • Registration of the CO2-(and NOx)-emissions will be done bythe ‘Nederlandse Emissie Autoriteit’ (NEa). • Large differences between allocations in different EU countries. • Outside Netherlands only limited use of benchmarking results.
EU Emission Trading SchemeAllocation under Dutch NAP Allocation = HE x G x E x C HE = Historic emissions installation (2001–2002) G = Growth factor within the sector E = Energy-efficiency ratio (World-top energy-efficiency / Own energy-efficiency) C = Factor to remain within the total cap
EU Emission Trading Scheme Yearly monitoring / selling & buying of allowances • Yearly monitoring, verification and registration of the CO2-emissions on the basis of Monitoring & Verification Protocols (next to the monitoring of NOx-emissions for which a national trading scheme is being developed). • Operators of a EU ETS installation will be required to surrender by30th April a number of CO2-emission allowances equal to theirverified annual emissions for the previous calendar year. • Emission trading: selling of allowances when surplus or buying when shortage – direct or via an ‘exchange’ set up by a trader/bank. • Current indicative trading level: ~ € 14 / t CO2. • Sanctions to apply in case of non-compliance.
EU Emission Trading Scheme CO2 price development EU emission market
EU Emission Trading Scheme Second round ETS • Second round EU ETS is period 2008 – 2012. • NAP’s for this round will have to be established by mid 2006. • Definition of (combustion) installations covered by ETS. • Discussion on EU-wide use of CO2-benchmarks. • Leakage effects - re-allocation of production elsewhere. • World-wide trading of CO2-emission rights
EU ‘Cap-and-Trade’ systemSome Government and Industry Perspectives • Government: - Absolute cap on CO2-emissions (per installation) - Ex-ante trading scheme - Regulations and enforcement - IPPC and EU decision making processes • Industry: - PSR’s (Performance Standard Rates) for CO2-emissions - Ex-post trading scheme - Practicality and flexibility - Administrative effort and cost - Unlevel playing field and uncertainty - Increase in electricity prices - Competitive position vis-à-vis the the ‘rest-of-the-world’ (in particular the US and the Far-East)
Agenda • Kyoto Protocol – History and Implementation • Benchmarking – Methodology and Process • Covenant Benchmarking Energy-efficiency • Kyoto Protocol – Current Status and Progress • EU Emission Trading Scheme • Future Developments
Future developmentsPost-Kyoto Protocol period • The Kyoto Protocol runs until 2012, thereafter ? • No agreement on post-Kyoto architecture at COP-10 Seminar of Governmental Experts to be held in May 2005 in Paris. • Position of countries which have not ratified the Kyoto Protocol (in particular the US and AU) or which have no obligations yet to reduce their GHG-emissions (China, India, Brazil, …). • Various targets and schemes are being put forward: e.g. a 15-30% reduction of the EU GHG-emissions by 2020 to a ‘Contraction & Convergence’ (C&C)-scheme by NGO’s. • How to involve all major GHG-emission countries.
Future developments Post-Kyoto treaty architecture • Some essential criteria for any post-Kyoto treaty architecture: - Environmental Effectiveness - Cost-effectiveness - Equity - Dynamic flexibility • Benchmarking is a crucial tool to fulfill these criteria. • Other important factors: - Technology development and transfer - Compatibility with Development Goals