Understanding Population Dynamics: Growth Patterns, Ecological Footprint, and Sustainability
This chapter explores essential concepts in population ecology, including demography, growth patterns, and ecological footprints. Key topics include semelparity, iteroparity, carrying capacity, and the differences between exponential and logistic growth curves. The chapter also examines survivorship curves, life history strategies, and factors affecting population growth. Additionally, practical ways to reduce ecological footprints are discussed. Understanding these principles is crucial for addressing population sustainability and environmental impact.

Understanding Population Dynamics: Growth Patterns, Ecological Footprint, and Sustainability
E N D
Presentation Transcript
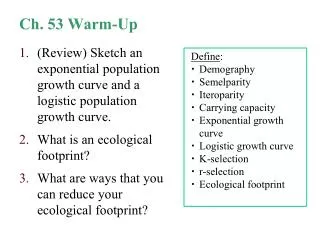
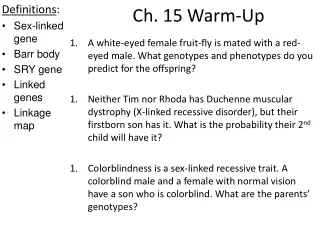
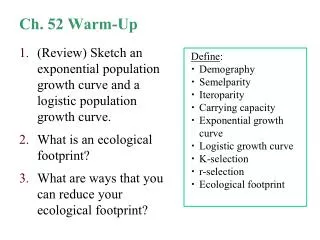
Ch. 52 Warm-Up • Define: • Demography • Semelparity • Iteroparity • Carrying capacity • Exponential growth curve • Logistic growth curve • K-selection • r-selection • Ecological footprint • (Review) Sketch an exponential population growth curve and a logistic population growth curve. • What is an ecological footprint? • What are ways that you can reduce your ecological footprint?
Chapter 52 Population Ecology
Population = group of individuals of a single species living in same general area Density: # individuals / area Dispersion: pattern of spacing between individuals Introduction
Determining population size and density: • Count every individual • Random sampling • Mark-recapture method
Patterns of Dispersal: • Clumped – most common; near required resource • Uniform – usually antagonistic interactions • Random – not common in nature
Additions occur through birth, and subtractions occur through death. Life table : age-specific summary of the survival pattern of a population Represent data with a survivorship curve. Plot # of individuals in a cohortstill alive at each age. Demography: the study of vital statistics that affect population size
Survivorship Curves: • Type I curve: low death rate early in life (humans) • Type II curve: constant death rate over lifespan (squirrels) • Type III curve: high death rate early in life (oysters)
Life History: traits that affect an organism’s schedule of reproduction and survival 3 Variables: • Age of sexual maturation • How often organism reproduces • # offspring during each event Note: These traits are evolutionary outcomes, not conscious decisions by organisms
Semelparity • Big-bang reproduction • Many offspring produced at once • Individual often dies afterwards • Less stable environments Agave Plant
Iteroparity • Repeated reproduction • Few, but large offspring • More stable environments Lizard Critical factors: survival rate of offspring and repeated reproduction when resources are limited
N/t = B-D N = population size t = time Change in Population Size Change in population size during time interval Births during time interval - Deaths during time interval =
Zero population growth: B = D • Exponential population growth: ideal conditions, population grows rapidly
Unlimited resources are rare Logistic model: incorporates carrying capacity (K) K = maximum stable population which can be sustained by environment dN/dt = rmax((K-N)/K) S-shaped curve
Factors that limit population growth: • Density-Dependent factors: population matters • i.e. Predation, disease, competition, territoriality, waste accumulation, physiological factors • Density-Independent factors: population NOT a factor • i.e. Natural disasters: fire, flood, weather
K-selection: pop. close to carrying capacity r-selection: maximize reproductive success
1000 Human (type I) Hydra (type II) 100 Survival per thousand Oyster (type III) 10 1 0 25 50 75 100 Percent of maximum life span Life strategies & survivorship curves Which graph represents K-selection and which graph represents r-selection? K-selection r-selection
Populations fluctuate due to biotic and abiotic factors 1975-1980: peak in wolf numbers 1995: harsh winter weather (deep snow)
What do you notice about the population cycles of the showshoe hare and lynx?
Boom-and-bust cycles • Predator-prey interactions • Eg. lynx and snowshoe hare on 10-year cycle
Human Population Growth • 2 configurations for a stable human population (zero population growth): • High birth / high death • Low birth / low death • Demographic transition: occurs when population goes from A B
Global Carrying Capacity • UN predicts: 7.8 to 10.8 billion people by the year 2050 • 2012 = 7 billion • Estimated carrying capacity = 10-15 billion? • Ecological footprint: total land + water area needed for all the resources a person consumes in a pop. • 1.7 hectares (ha)/person is sustainable(hectare= 100m by 100m) • U.S.: 10 ha/person over K?? Limitations? Consequences? Solutions?
Map of ecological footprint of countries in the world (proportional sizes shown)