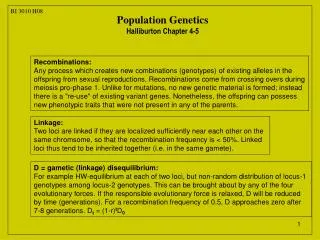
ITEC 3010 Design
ITEC 3010 Design. The Structure Chart. Structure chart A hierarchical diagram showing the relationships between the modules of a computer program


ITEC 3010 Design
E N D
Presentation Transcript
The Structure Chart • Structure chart • A hierarchical diagram showing the relationships between the modules of a computer program • The objective of structured design is to create a top-down decomposition of the functions to be performed by a given program in a system – use a structure chart to show this • E.g. shows functions and sub functions (such as Calculate base amount, Calculate overtime amount etc.) • Uses rectangles to represent each such module (the basic component of a structure chart • Higher-level modules are “control” modules that control flow of execution (call lower level modules which are the “worker bee” modules that contain program logic)
Structure Chart characteristics • Structure chart is based on the idea of modular programming (and top-down programming) • Breaking a complex problem down into smaller modules • Modules are well formed with high internal cohesiveness and minimum data coupling • Vertical lines connecting the modules indicate calling structure • Little arrows next to the lines show the data passed between modules (inputs and outputs) • Data couples: individual items that are passes between modules • Program call: the transfer of control from a module to a subordinate module to perform a requested service (can be implemented as e.g. a function or procedure call)
Structure Chart Symbols • Rectangles represent modules • Can represent a function (e.g. C), a procedure (e.g. Pascal), a paragraph (e.g. COBOL) , subroutine (e.g. FORTRAN) etc. • Rectangle with double bars represents a module used several places (optional) • Little arrows with open circles represent data couples • Little arrows with closed circles represent control couple flag (e.g. end of file flag) • Curved arrows immediately below a boss module represents iteration (looping) • Darkened diamond represents a conditional call to lower modules
Notes on Structure Chart • Each module does a very specific function • Module at top of the tree is the boss module • Function is to call modules on level below, pass information to them • Middle level modules control the modules below • Call them and pass data • At the very bottom, the leaves contain the actual algorithms to carry out the program functions • Call of modules is left to right across the tree
Developing a Structure Chart • Transaction analysis • The development of a structure chart based on a DFD that describes the processing for several types of transactions • Uses as input the system flow chart and the event table to develop the top level of the tree in a structure chart • Transform analysis • The development of a structure chart based on a DFD that describes the input-process-output data flow • Used to develop the subtrees in a structure chart – one for each event in the program
Transaction Analysis • First step is to identify the major programs • Can do it by looking at the system flow chart and identifying the major programs • For a subsystem or program we want to make a structure chart for, we can look at the event-partitioned DFD to identify the major processes • See next slide, shows event-partitioned DFD for the order-entry subsystem for RMO example, showing 5 major processes • These major processes will become the modules in the resulting high level structure chart (see slide after that) • Sub-System DFD and DFD Level 0 are also a good source
Transform Analysis • Based on the idea that computer program “transforms” input data into output data • Structure charts developed with transform analysis usually have 3 main subtrees • Input subtree to get data • A calculate subtree to perform logic • An output subtree to write the results • Can create it rearranging elements from • DFD fragment for an event (e.g. “create new order”) • The detailed DFD for that event • E.g. see next two slides for “create new order” DFD fragment, and its corresponding detailed DFD
Steps for creating the structure chart from the DFD • Identify the primary information flow • Find the process that represents the most fundamental change from an input stream to an output stream – the central transform • Afferent data flow: the incoming data flow in a sequential set of process bubbles • Efferent data flow: the outgoing data flow from a sequential set of process bubbles • Central transform: the central processing bubbles in a transform analysis type of data flow • In our example, the record (build) order process is the central process
Steps continued 3. Redraw the data flow diagram (DFD) with • The inputs to the left • The central transform process in the middle • The outputs to the right • The parent process (top level – e.g. “Create new order”) above the central transform process (e.g. “Build order”) • See next slide
Record Order
Steps continued 4. Generate the first-draft structure chart including data couples (directly from our rearranged DFD on the previous slide) • See next slide
Record Order
Steps continued 5. Add other modules as necessary to • Get input data via the user-interface screens • Read and write to the data stores • Write output data or reports • These are lower level modules (utility modules) • Also add data couples • See next slide
Record Order
Final Steps 6. Using structured English or decision table documentation, add any other required intermediate relationships (e.g. looping and decision symbols) 7. Make the final refinements to the structure chart based on quality control concepts (to be discussed)
Combining the top-level structure chart with the chart developed by transaction analysis • Basically “glue” the diagram we made (high-level) using transaction analysis on top of the more detailed diagram (for lower-processing) we just made using transform analysis • See next slide
Evaluating the Quality of a Structure Chart • Module coupling • The manner in which modules relate to each other • Desirable to have loosely coupled modules – have modules as independent as possible • Module does not need to know who invoked it • Best coupling is through simple data coupling • The module is called and a specific set of data items is passed • Module function performs its function and returns the output
Evaluating Structure Charts (continued) • Cohesion • Refers to the degree to which all of the code within a module contributes to implementing one well-defined task • Desirable to have modules with high cohesion implementing a single function • Modules that implement a single task tend to have relatively low coupling because all of their internal code acts on the same data item(s) • Modules with poor cohesion tend to have high coupling because loosely related tasks are typically performed on different data items across modules • A flag passed down the structure chart is an indicator of poor cohesion
Module Algorithm Design: Pseudocode • Next requirement • Describe the internal logic within each module • Possible methods • Flow charts • Structured English • Pseudocode (variation of structured English similar to programming language that will be used – e.g. COBOL like or C like pseudocode) • Decision Tree/Table
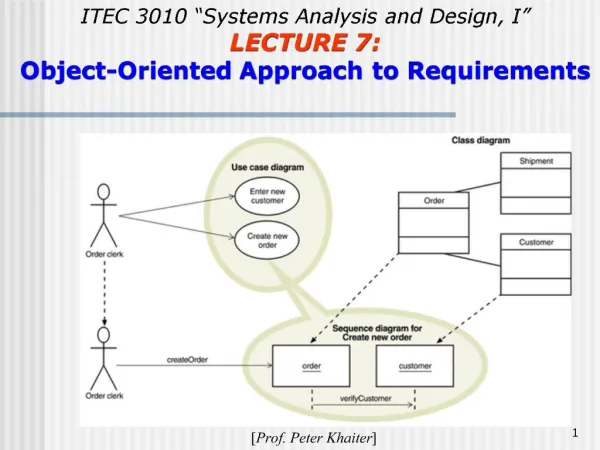
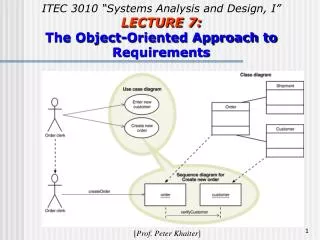
Designing the Application Architecture:The Object-Oriented Approach • Object-oriented design models provide the bridge between the object-oriented analysis models and the object-oriented programs • Object-oriented programs • Basic concept: the program consists of a set of program objects that cooperate to accomplish a result • Objects work together by sending messages • Example: in a graphical user interface (GUI) windows and menus are objects. If you click on a window object a message is sent to display itself (e.g. window, a menu bar etc.)
Differences between object oriented and traditional approaches • In traditional computer environments there is some sort of central control • E.g. a mainframe computer may be connected to thousands of terminals and controls them centrally • No terminal does work unless directed to by the mainframe • In object-oriented environment • Analogy to a network of nodes, where each node can send messages to other independently, but all still work together, not centrally controlled (no one may be in charge)
Overview • Programmers use models to code the system • Two most important models are design class diagrams and interaction diagrams (sequence diagrams and collaboration diagrams) • Class diagrams are developed for domain, view, and data access layers • Interaction diagrams extend system sequence diagrams
Object-Oriented Design – The Bridge Between Analysis and Programming • Bridge between user’s requirements and new system’s programming • Object-oriented design is the process by which detailed object-oriented models are built • Programmers use the design to write code and test new system • User-interface, network, controls, security, and database requires design tasks and models
Overview of Object-Oriented Programs • Set of objects that cooperate to accomplish result • Object contains program logic and necessary attributes in a single unit • Objects send each other messages and collaborate to support functions of main program • OO system designer provides detail for programmers • Design class diagrams, interaction diagrams, (some) statechart diagrams
Object-Oriented Design Processes and Models • Diagrams developed during analysis • Use case diagrams, use case descriptions and activity diagrams, domain model class diagrams, and system sequence diagrams • Diagrams developed during design • Design class diagrams – set of object-oriented classes needed for programming, navigation between classes, attribute names and properties and method names and properties • Interaction diagrams, package diagrams
Iterative Process of OO Design • Create preliminary design class diagrams model • Develop interaction diagrams for each use case or scenario (realization of use cases) • Return to design class diagram • Develop method names based on the design of interaction diagrams • Update navigation visibility and attributes • Partition design class diagram into related functions using package diagrams (subsystems or layers)
Design Class Symbols • UML does not distinguish between design class notation and domain model notation • Domain modeling shows users’ work environment • Design class specifically defines software classes • UML uses stereotype notation to categorize a model element by its characteristics
Standard Design Classes • Entity – design identifier for problem domain class • Persistent class – exists after system is shut down • Boundary – designed to live on system’s automation boundary • User interface and windows classes • Control – mediates between boundary and entity classes, between the view layer and domain layer • Data access – retrieve from and send data to database
Design Class Notation • Name – class name and stereotype information • Attributes – visibility (private or public), attribute name, type-expression, initial-value, property • Method signature – information needed to invoke (or call) the method • Method visibility, method name, type-expression (return parameter), method parameter list (incoming arguments) • Overloaded method – method with same name but two or more different parameter lists
Student Class Examples for the Domain Diagram and the Design Class Diagram
Some Fundamental Design Principles • Encapsulation – each object is self-contained unit that includes data and methods that access data • Object reuse – designers often reuse same classes for windows components • Information hiding – data associated with object is not visible to outside world • Navigation visibility – object is able to view and interact with another object
Coupling and Cohesion • Coupling – qualitative measure of how closely classes in a design class diagram are linked • Number of navigation arrows on design class diagram • Low: system is easier to understand and maintain • Cohesion – qualitative measure of consistency of functions within a single class • Separation of responsibility – divide low cohesive class into several highly cohesive classes
Developing the First-Cut Design Class Diagram • Extend domain model class diagram: • Elaborate attributes with type and initial value information • Add navigation visibility arrows • Detailed design proceeds, use case by use case: • Interaction diagrams implement navigation • Navigation arrows are updated to be consistent • Method signatures are added to each class