Download
1 / 16
160 likes | 333 Vues
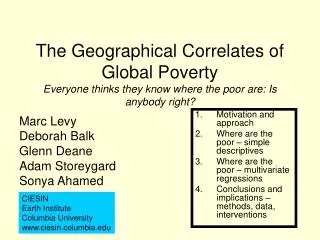
The Geographical Correlates of Global Poverty Everyone thinks they know where the poor are: Is anybody right?. Motivation and approach Where are the poor – simple descriptives Where are the poor – multivariate regressions Conclusions and implications – methods, data, interventions. Marc Levy

E N D
The Geographical Correlates of Global PovertyEveryone thinks they know where the poor are: Is anybody right? • Motivation and approach • Where are the poor – simple descriptives • Where are the poor – multivariate regressions • Conclusions and implications – methods, data, interventions Marc Levy Deborah Balk Glenn Deane Adam Storeygard Sonya Ahamed CIESIN Earth Institute Columbia University www.ciesin.columbia.edu
Motivations Describe spatial patterns Hotspots, traps, anomalies, … Test hypotheses Climate, elevation, disease vectors, access to markets, soil fertility as constraints on human development Explore differences in regional patterns Do these relationships vary across world regions? Support design of effective interventions Facilitate interdisciplinary research on poverty contingent on spatial dynamics
Infant Mortality Rate 0-15: Not poor 15-32: Somewhat poor 32- 65: Moderately poor 65-100: Poor 100- up: Extremely poor
Drought (3 consecutive overlapping 3-month seasons with rainfall at least 50% below normal)
Growing Season and Drought Distribution of non-poor population Distribution of poor and extremely poor population
Spatial dependencies confound ability to calculate regression models
Access behaves largely as expected. Pop Density or Transport always sig; not always both. Asia an anomaly (China effect?) Anomalies: Africa elevation effect (malaria?) Chemical soil properties Slope Most consistent biophysical effects: Drought Physical and mineral soil deficiencies Malaria
Conclusions • Observations, methods need to catch up. • Global patterns discernible, but clear regional differences. • Clear impact of geographic factors weakly reflected in dominant intervention debates.
TRANSPORTATION INTERNATIONAL the coalition for access Transportation International Market Access Index 2004 Remoteness is rampant in 60 countries, and poor farmers face high input prices and poor opportunities to sell products, says TI Transportation International’s Access Index ranks a record 146 countries; most sub-Saharan African countries are prone to high remoteness