Download

1 / 13
130 likes | 245 Vues
This overview highlights the devastating impacts of exploration, slavery, and disease on Native American and African populations in the Americas. Europeans exploited both groups for forced labor, leading to immense suffering and high mortality rates due to overwork and disease. Millions of Africans were forcibly transported across the Atlantic, facing horrific conditions on slave ships, with many dying before ever reaching their destinations. The Taino population experienced drastic declines post-contact with Europeans, illustrating the tragic consequences of colonization.

E N D
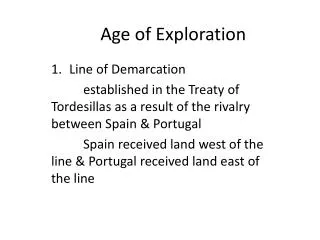
Effects of Exploration Slavery and Disease
Directions • Write everything that is written in yellow.
Europeans, especially in the Caribbean and South America, used Native Americans as forced labor/slaves until they died of overwork and/or disease • Same brutal work conditions
African Slavery • Millions of Africans were brought to the Americas as slaves. • Estimates range between six and ten million or more! • Between six and ten million Africans were brought to the Americas.
Conditions on the ship were horrible. • * No space • * Hot • Men chained together • *Brutal discipline • No restrooms • * No air • * Force fed if enslaved peoplerefused to eat • * Violence
rs Once they arrived… • * Sold to new owner • * 90% of all Africans sent to South America or the Caribbean. • *6 % sent to what is now the United States • Life expectancy in the Caribbean wasless than three years • * Conditions varied from bad to unbearable
Create a graph • The Tainos were the first Native Americans that Columbus encountered. Use the information on the next slide to create a graph showing what happened to the Taino population after contact with Europeans.
Create your graph. • 1. Draw your x axis. Draw your y axis. • 2. Label the x axis YEARS. • 3. Label your y axis POPULATION IN THOUSANDS. • 4. Think about a number scale you can use for the y axis. • 5. Fill in the numbers on the y axis. • 6. Write a title on the top of your graph. • 7. Use the information on the next slide to finish your graph.
X Axis-years Y Axis-population • 1492 – 1,000,000 • 1496 – 950,000 • 1507 – 60,000 • 1508 – 30,000 • 1518 – 3,000 • 1530 – 1148 • 1542 - >500