Download
1 / 13
130 likes | 224 Vues
Explore the influence of federal government expenditures and revenues on the economy, analyzing trends from 1960 to 2003. Learn about fiscal policy, budget deficits, debt, spending behaviors, tax policies, and the effects of contractionary and expansionary measures. Discover how automatic stabilizers, the impact of tax cuts on demand and supply sides, and the role of top earners in personal income taxes shape economic outcomes.

E N D
Fiscal Policy Chapter 12
Expenditures Deficits Revenues Federal Expenditures and Revenues Federal Government Expenditures and Revenues(as a share of GDP) 24% 22% 20% 18% 1960 1965 1970 1975 1980 1985 1990 1995 2000 2003 Source:Economic Report of the President, 2004, tables B-1 and B-79. Note, recessions are indicated by shaded bars.
Fiscal Policy Government spending. Taxes. Under the control of the Treasury.
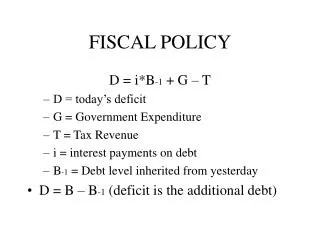
Budget Deficit The difference between government spending and tax revenues. Debt: accumulated deficit http://www.brillig.com/debt_clock/ http://www.youtube.com/watch?v=1mTj33oepkQ&eurl=http://home.manhattan.edu/~fiona.maclachlan/weblog/2007_05_01_archive.html
Spending Autonomous: the same regardless of the level of income Induced: dependent on the level of income
Rate of change of Y with a change in G where c is the marginal propensity to consume
Contractionary vs Expansionary Fiscal Policy • Contractionary: cut spending, raise taxes, reduce deficit • Expansionary: increase spending, lower taxes, increase deficit
Automatic Stabilizers Taxes. Unemployment insurance. Welfare.
The following quotation is from the mid-1980s by Paul Samuelson, a leading American Keynesian: “In the early stages of the Keynesian revolution, macro-economists emphasized fiscal policy as the most powerful and balanced remedy for demand management. Gradually, shortcomings of fiscal policy became apparent. The short- comings stem from timing, politics, macro- economic theory, and the deficit itself."
Decline inprivate investment Increase in budget deficit Higher realinterest rates Appreciation of the dollar Decline in net exports Inflow of financial capital from abroad Crowding-Out in an Open Economy
Effect of a Tax Cut (T): Demand Side In the first round the addition to the GDP is c T. Multiply c T by the multiplier to get the total effect.
Effect of Tax Cut:Supply Side Increased incentive to produce, a lower cost of production.
1986Top rate cut from50% to 30% 1997Capital gainstax rate cut 1964-65Top rate cut from91% to 70% 1990-93Top rate raised from30% to 39% 1981Top rate cut from70% to 50% Share of personal income taxes paid by top ½ % of earners 30 % 28 % 26 % 24 % 22 % 20 % 18 % 16 % 14 % 1960 1965 1970 1975 1980 1985 1990 1995 2000 • The share of personal income taxes paid by the top one-half percent of earners is shown here. • During the last four decades, the share of taxes paid by these earners has increased as the top tax rates have declined. This indicates that the supply side effects are strong for these taxpayers.