Fiscal Policy and Supply-Side Economics in Government Decision-Making
330 likes | 441 Vues
Explore the impact of fiscal policy on economic cycles and growth, along with supply-side strategies to enhance the private sector. Learn about tax implications, multiplier effects, Laffer Curve, and the challenges of Reaganomics. Discover how government spending and taxation influence national income and wealth distribution.

Fiscal Policy and Supply-Side Economics in Government Decision-Making
E N D
Presentation Transcript
Fiscal Policy Taxing and spending decisions by government (Congress and President)
I. Demand-Side Economics • Keynes: GD because neither producers nor consumers had incentive to spend enough to cause increase in production • Washington Baby Sitter Co-op • Role for government: counter-cyclical—spend/cut taxes during recession, raise taxes/cut spending during expansion • Pump-priming • Works best in “liquidity trap” (interest rates 0%) otherwise monetary policy better (crowding out, inefficiencies + disincentives) • Political “realities”: spending easy in recession, cuts hard in boom years procyclical policies and budget deficits + debt (see below) • May not actually be true: see, 1990s and 2010s
Multiplier Effect: for every one dollar change in fiscal policy creates a greater than one dollar change in national income • Gov Bob Jane Nate etc. 1/MPS or 1/(1-MPC) Marginal Propensity to Save / Consume • Complex multiplier:2x • Strongest horizontal, less intermediate, 0 vertical • Balanced Budget multiplier: 1x spending change • So: Cutting government spending by $66B and cutting taxes by $66B will drop GDP by $66B and increase unemployment
Automatic Stabilizers: government programs that change automatically depending on GDP and personal income (counter-cyclical) • Transfer payments: welfare, Medicare • Taxes (iffprogressive; regressive destabilizes) • Progressive: more $ more % (federal income) • Regressive: less $ more % (sales tax) • Flat: all same %
Inelastic demand consumers pay most of tax (e.g. gas) [+ inelastic supply Elastic demand producers pay most of tax
True Tax Burden • Lost consumer/producer surplus: $1,000/gallon milk tax no milk produced no tax revenue but loss consumer/producer surplus • IF leads to reallocation to more efficient usages, then no burden • E.g. tax negative externalities and fund positive externalities
II. Supply-Side Economics Focus on Aggregate Supply and freeing up private sector to reduce costs and shift AS right Policy prescriptions: • Deregulation (reduce costs + increase competition + efficiency: false natural monopolies) • Adverse effects gov’t spending (esp. welfare) • Focus disincentive effect of taxes • Example: raising corporate taxes reduces incentive to produce and hire • Progressive (higher income higher %), regressive (lower income higher %:speeding ticket, sales tax), flat (all same %) • Federal: progressive marginal • Brackets
General agreement: tax cuts inc AS in long run (but probably more AD short run) • (disagreement costs + benefits) • Major point divergence w/in SS: Laffer Curve + Reagonomics “Trickledown” vs. GHWB: “Voodoo Economics” “Dynamic” vs. “Static” scoring
Problems with Reaganomics • 1) Doesn’t work as advertised: 1980s, 2000s: massive deficits (+ massive debt); rich don’t invest more (a) cutting income tax encourages earning income rather than investment, b) lack of viable investments) • 2) Top marginal tax rates already low [high 90% in 1940s, 70% 1960, 30% 1990; Clinton tax increase 200040%: revenue up, growth up (doesn’t disprove, but seriously questions)] rich richer, poor poorer • 3) Crisis (you didn’t really expect nothing to ever go wrong did you Pollyana?) • 4) Efficiency can be the enemy of stability (and growth in the long run: static efficiency vs. creative destruction)
Econ 101 Works • Expansionary fiscal policy is expansionary; contractionary fiscal policy is contractionary
Post-WWII GDP Growth by Administration • #1: Kennedy-Johnson (49 percent over eight years) • #2: Clinton (34 percent) • #3: Reagan (32 percent) • #4: Nixon-Ford (24 percent) • #5: Eisenhower (21 percent)
Why doesn’t work? • Marginal Propensity to Consume (MPC) vs. Marginal Propensity to Save (MPS) • MPC .75 $6.67 B to increase AD $5B • $1.67 in S • If tax cut goes to wealthy, MPC even lower tax cut must be even larger • 2003 tax cuts: $726 B in cuts to create 1.4 million jobs • 726/1.4= little over $500,000 • Average US job pays $40,000 x 10 years= $400,000 • Actual job creation: 0 (would have been negative even before recession except for public sector growth) • Well, what about savings and investment? • US savings rate practically 0, if not negative • “Supply-side” tax cuts primarily effect demand (C+I), especially in short term • Also, Federal tax cuts less money to States (e.g. education, Medicare) spending cuts (AD) or tax increase (regressive State taxes, AD; “50 Herbert Hoovers”)
Lucky Duckies • Wall Street Journal Op-ed (Nov 2002): tax system creates 2 classes: those who pay huge taxes and those who pay none (don’t have “blood boiling with tax rage”) don’t see costs of gov’t don’t support “tax relief” • Top 50% pay 96% of federal income taxes • Top 5% pay 56% of federal income taxes • + Earned Income Tax Credit (EITC): compromise in 1996 Welfare Reform act • “Say a person earns $12,000. After subtracting the personal exemption, the standard deduction and assuming no tax credits, then applying the 10% rate of the lowest bracket, the person ends up paying a little less than 4% of income in [Federal income] taxes. It ain't peanuts, but not enough to get his or her blood boiling with tax rage.” • “Workers who pay little or no taxes can hardly be expected to care about tax relief for everybody else. They are also that much more detached from recognizing the costs of government.” (vote Democratic) • Suggestion: should raise taxes on the poor to get them to vote for “tax relief” (vote Republican) • http://luckyduckies.blogspot.com/2004/11/wall-street-journal-lucky-duckies.html
But… • 1) Poor people vote much lower rate • 2) The rich benefit more from gov’t: over $100,000 got $9,280 in benefits; under $10,000 got $5,560 (in 1992, probably worse now) • Whole argument for progressive taxes to begin with: William Jennings Bryan (1894)—"Who is it most needs a navy? Is it the farmer who plods along behind the plow upon his farm, or is it the man whose property is situated in some great seaport where it could be reached by an enemy's guns?" • 3) Tax code isn’t progressive when add all taxes
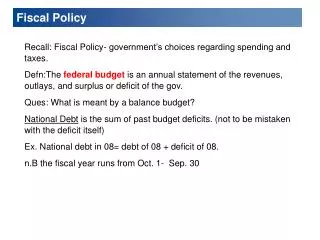
III. The Budget • Deficit: the amount the government spends more than it takes in (2010 $1.4 trillion; 2013 $680 billion) • Surplus: takes in more than spends • Debt: all the money the federal government owes to bondholders (2013: $17 trillion; mostly to US citizens)
Problems with Debt / Deficit • 1) Crowding-out: investment in government bonds means less money available for private investment • Unless: a) money wasn’t going to be borrowed/invested anyway (GD), or b) Fed easy money (offsets IR up; “zero lower bound”: 2007 on)
If the government deficit spends, where does it get the money? It must borrow in the Loanable Funds Market. Slf What entities demand money in the loanable funds market? As the government borrows money in the loanable funds market, money demand increases i1 Dlf1 i Households Dlf Firms causing interest rates to go up. Q Government Loanable Funds
Slf i1 Dlf1 i Dlf Q Loanable Funds Higher interest rates crowd out private borrowing that would have occurred at the lower interest rate.
2) Servicing the debt: interest payments • 3) Deficit inflation higher interest rates slower economy less tax revenue more deficit • 4) Default? How secure are US bonds? $45 trillion Medicare and Social Security “debt” • (add up future deficits, discount to today’s $s)
Net Exports Effect • Crowding-out higher IR greater demand US financial assets (bonds, savings accounts, etc.) greater demand US $ $ value up US goods more expensive compared foreign goods (foreign cheaper) exports down + imports up GDP down (partially offsets expansionary policy)